GBP/USD Forecast: Pound Sterling eyes further losses after UK inflation data
- GBP/USD dropped to a fresh multi-month low below 1.2350 on Wednesday.
- Annual inflation in the UK for August came in below market expectations.
- Investors await the Fed's monetary policy announcements and the revised dot plot.

GBP/USD came under heavy bearish pressure and touched its lowest level in nearly four months at 1.2333 in the European morning before recovering back above 1.2350.
Inflation in the UK, as measured by the change in the Consumer Price Index (CPI), edged lower to 6.7% on a yearly basis in August from 6.8% in July, the UK's Office for National Statistics reported on Wednesday. More importantly, the Core CPI inflation, which excludes volatile food and energy prices, softened to 6.2% from 6.9% in the same period. Both of these readings came in below market expectations, forcing Pound Sterling to weaken against its major rivals.
According to Reuters, the probability of the Bank of England (BoE) holding its policy rate steady on Thursday climbed to 50% after UK inflation data, up considerably from 20% earlier in the week. Reflecting the impact of dovish BoE bets, the 2-year UK gilt yield fell more than 3%.
Pound Sterling price today
The table below shows the percentage change of Pound Sterling (GBP) against listed major currencies today. Pound Sterling was the weakest against the Euro.
| USD | EUR | GBP | CAD | AUD | JPY | NZD | CHF | |
| USD | -0.16% | 0.17% | 0.02% | -0.05% | 0.20% | 0.14% | -0.02% | |
| EUR | 0.16% | 0.32% | 0.18% | 0.15% | 0.35% | 0.30% | 0.14% | |
| GBP | -0.15% | -0.32% | -0.13% | -0.17% | 0.04% | -0.02% | -0.18% | |
| CAD | -0.02% | -0.20% | 0.15% | -0.03% | 0.18% | 0.12% | -0.04% | |
| AUD | 0.05% | -0.15% | 0.16% | 0.05% | 0.20% | 0.15% | 0.00% | |
| JPY | -0.19% | -0.32% | -0.01% | -0.17% | -0.18% | -0.04% | -0.21% | |
| NZD | -0.14% | -0.30% | 0.02% | -0.12% | -0.17% | 0.06% | -0.16% | |
| CHF | 0.02% | -0.14% | 0.19% | 0.05% | 0.01% | 0.22% | 0.16% |
The heat map shows percentage changes of major currencies against each other. The base currency is picked from the left column, while the quote currency is picked from the top row. For example, if you pick the Euro from the left column and move along the horizontal line to the Japanese Yen, the percentage change displayed in the box will represent EUR (base)/JPY (quote).
In the late American session, the US Federal Reserve is forecast to keep its policy rate unchanged at 5.25-5.5%. According to the CME Group FedWatch Tool, markets still see a nearly 40% chance that the Fed will raise the interest rate by another 25 basis points before the end of the year. If the revised Summary of Projections (SEP), also known as the dot plot, confirms one more hike, GBP/USD could extend its slide. On the other hand, a dovish surprise, with the dot plot pointing to an end of the tightening cycle or at least 100 basis points rate cut projections for next year, could trigger a rebound in the pair.
Even if GBP/USD gains traction after the Fed event, investors could refrain from betting on a steady rebound ahead of the BoE's policy announcements on Thursday.
GBP/USD Technical Analysis
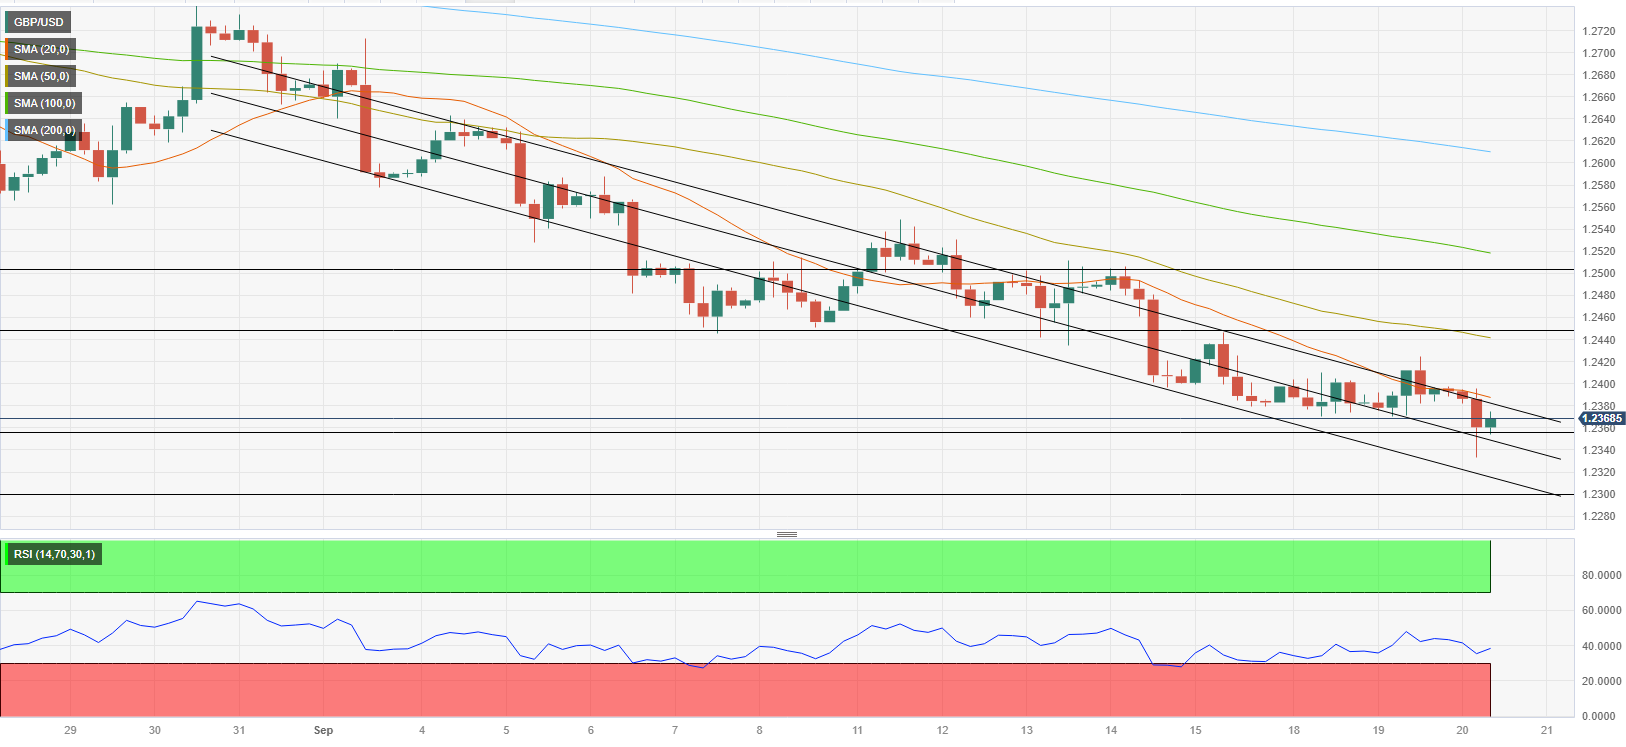
The near-term technical outlook highlights a bearish bias, with GBP/USD trading within the descending regression channel and the Relative Strength Index (RSI) indicator on the four-hour chart staying well below 50.
On the downside, 1.2350 (static level, mid-point of the descending channel) aligns as first support before 1.2300 (lower limit of the descending channel, static level) and 1.2240 (static level from March).
In case GBP/USD rises above 1.2400 (20-period Simple Moving Average (SMA), upper limit of the descending channel) and starts using that level as support, buyers could show interest. In that scenario, 1.2450 (static level, 50-period SMA) and 1.2500 (psychological level, static level) could be seen as next recovery targets.
Premium
You have reached your limit of 3 free articles for this month.
Start your subscription and get access to all our original articles.
Author

Eren Sengezer
FXStreet
As an economist at heart, Eren Sengezer specializes in the assessment of the short-term and long-term impacts of macroeconomic data, central bank policies and political developments on financial assets.


