GBP/USD Forecast: Pound Sterling eyes additional gains above 1.2450
- GBP/USD loses bullish momentum after testing key resistance area.
- US Dollar could struggle to gather strength amid dovish Fed bets.
- Market participants will pay close attention to US employment data.

GBP/USD lost traction, retreating toward 1.2400, after having closed the first three trading days of the week in positive territory. 1.2440/50 area aligns as key resistance and buyers could take action once that level is confirmed as support.
GBP/USD stayed under bearish pressure and dropped to the 1.2350 area in the first half of the day on Wednesday as safe-haven flows provided a boost to the US Dollar (USD). In the late American session, however, the USD lost its strength on improving risk mood after the US House of Representatives passed a bill to suspend the debt ceiling through January 1, 2025. Moreover, dovish comments from Federal Reserve (Fed) officials put additional weight on the USD's shoulders.
Philadelphia Fed President Patrick Harker and Fed Governor Philip Jefferson both voiced their willingness to skip a rate hike in June. The CME Group FedWatch Tool's probability for a 25 basis points rate increase at the upcoming policy meeting climbed above 60% following these comments from nearly 30% earlier in the day.
Nevertheless, the USD stays resilient against its peers early Thursday and limits GBP/USD's upside. The risk-positive market environment and the market pricing of the Fed's rate outlook, however, suggests that the USD could have a difficult time outperforming its major rivals.
In the early American session, the Automatic Data Processing (ADP) will release the private sector employment report. Markets expect an increase of 170,000 in May following the impressive 229,000 growth recorded in April. A weaker-than-expected reading should weigh on the USD in the near term and help GBP/USD stretch higher and vice versa. The US economic docket will also feature the ISM Manufacturing PMI survey for May. The headline PMI is forecast to stay below 50 and show an ongoing contraction in the sector's activity. This data is unlikely to support the USD unless it swings back above 50.
GBP/USD Technical Analysis
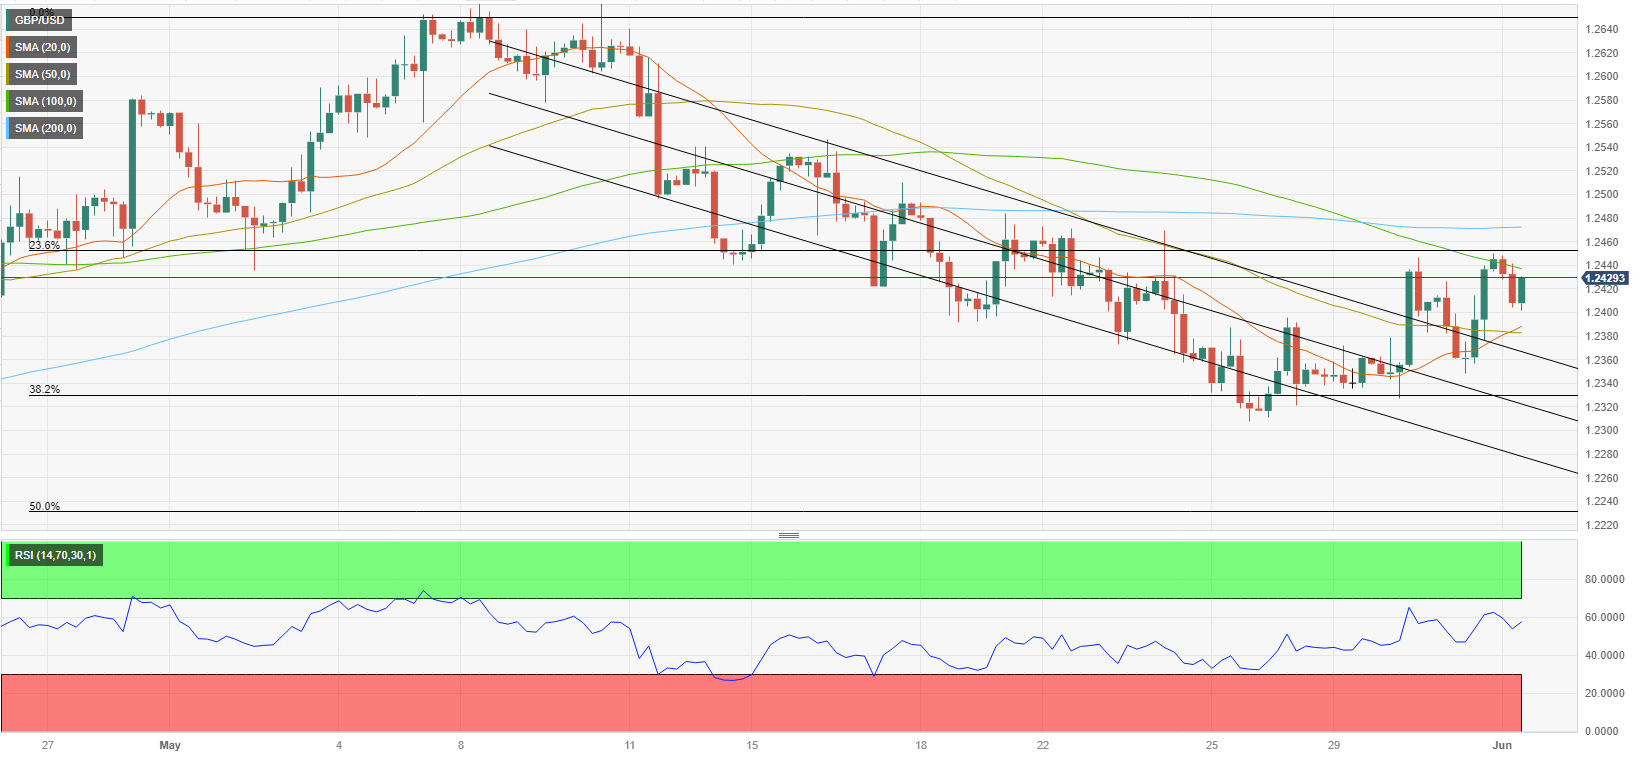
GBP/USD continues to trade outside the descending regression channel and the Relative Strength Index (RSI) indicator on the four-hour chart stays above 50, reflecting the bullish bias in the near term. On the upside, 1.2440/50 (100-period Simple Moving Average (SMA), Fibonacci 23.6% retracement of the latest uptrend) forms stiff resistance area. In case buyers flip that level into support, additional gains toward 1.2480 (200-period SMA) and 1.2500 (psychological level, static level) could be witnessed.
On the downside, 1.2400 (psychological level, static level) aligns as interim support ahead of 1.2380 (20-period SMA, 50-period SMA) and 1.2350 (upper limit of the broken descending channel).
Premium
You have reached your limit of 3 free articles for this month.
Start your subscription and get access to all our original articles.
Author

Eren Sengezer
FXStreet
As an economist at heart, Eren Sengezer specializes in the assessment of the short-term and long-term impacts of macroeconomic data, central bank policies and political developments on financial assets.


