- GBP/USD has turned south after having climbed above 1.2400 on Thursday.
- PCE inflation data from the US and month-end flows could ramp up market volatility.
- The pair could turn bearish if it breaks below 1.2350.
After having touched its highest level since late January at 1.2423 in the Asian session on Friday, GBP/USD has reversed its direction and declined below 1.2400. The pair closes in on key support level that aligns at 1.2350. The Personal Consumption Expenditures (PCE) Price Index data from the US will be watched closely by market participants. It's also worth noting that the market volatility is likely to pick up later in the day amid month and quarter-end flows.
Earlier in the day, the data published by the UK's Office for National Statistics revealed that the UK Gross Domestic Product (GDP) expanded at an annualized rate of 0.6% in the fourth-quarter. This reading followed the 0.4% growth recorded in the third quarter and came in better than the market expectation of 0.4%. Nevertheless, Pound Sterling failed to capitalize on the upbeat UK GDP data.
Meanwhile, the UK's FTSE 100 Index opened flat after having closed the first four trading days of the week in positive territory. Moreover, US stock index futures also stay virtually unchanged on the day, pointing to a cautious market stance.
The Core PCE inflation, the Fed's preferred gauge of inflation, is forecast to hold steady at 4.7% on a yearly basis in February. On a monthly basis, the Core PCE Price Index is expected to come in at 0.4% following January's 0.6% increase.
At the moment, the CME Group FedWatch Tool shows that markets are still indecisive about the US Federal Reserve's next rate decision. A stronger-than-expected monthly Core PCE inflation, at 0.6% or higher, could bring back hawkish Fed bets and cause GBP/USD to extend its daily correction and vice versa.
GBP/USD Technical Analysis
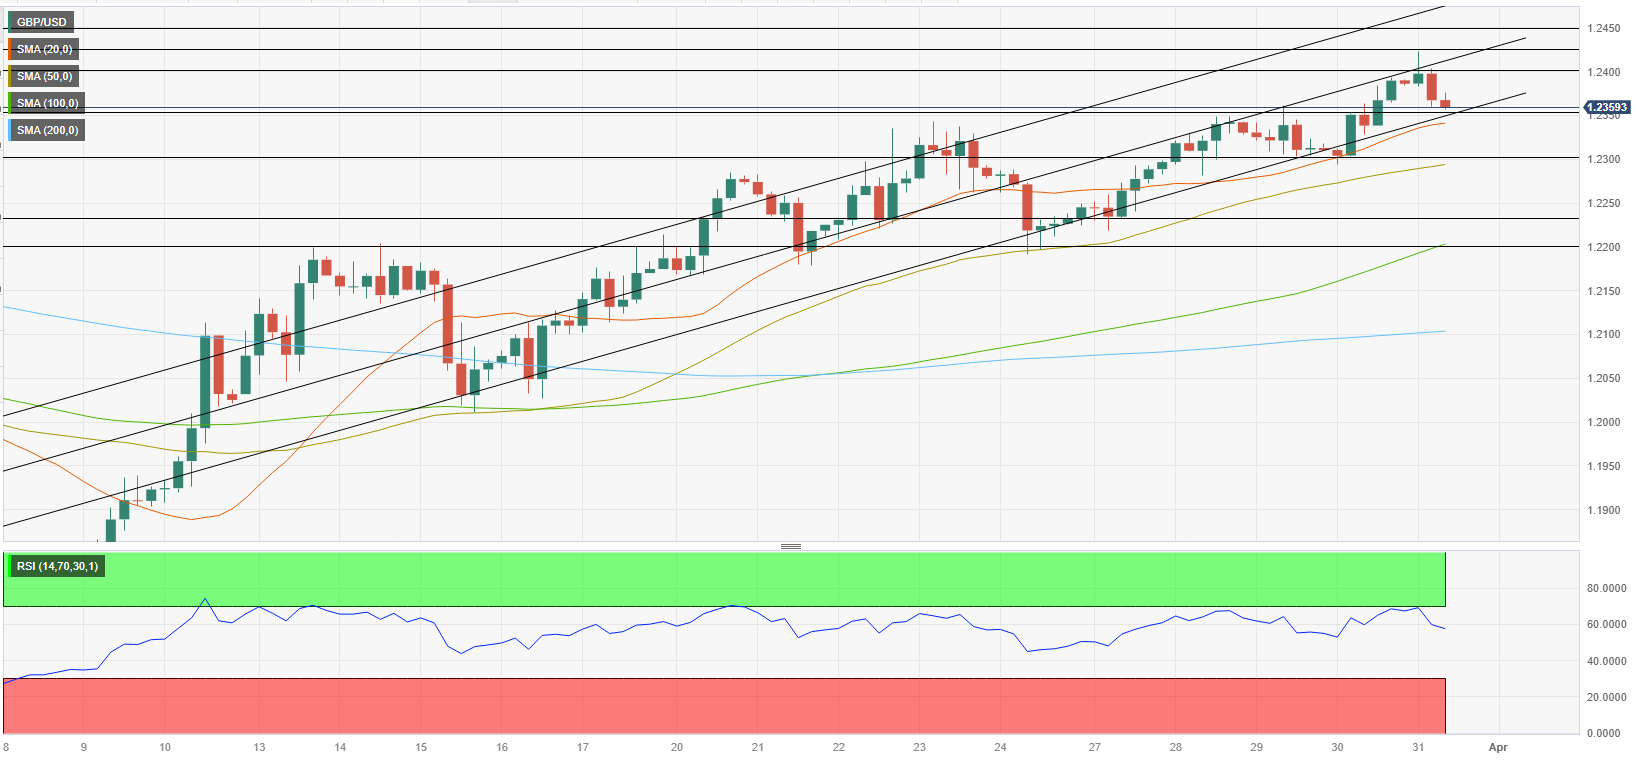
The lower limit of the ascending regression channel forms key support at 1.2350. This level is also reinforced by the 20-period Simple Moving Average (SMA) on the four-hour chart. If GBP/USD falls below that level and starts using it as resistance, it could continue to push lower toward 1.2300 (50-period SMA, psychological level) and 1.2230 (static level).
If 1.2350 stays intact, buyers could remain interested. In that scenario, resistances are located at 1.2400 (mid-point of the ascending channel), 1.2420 (multi-month high set on Friday) and 1.2450 (December 22 high).
Information on these pages contains forward-looking statements that involve risks and uncertainties. Markets and instruments profiled on this page are for informational purposes only and should not in any way come across as a recommendation to buy or sell in these assets. You should do your own thorough research before making any investment decisions. FXStreet does not in any way guarantee that this information is free from mistakes, errors, or material misstatements. It also does not guarantee that this information is of a timely nature. Investing in Open Markets involves a great deal of risk, including the loss of all or a portion of your investment, as well as emotional distress. All risks, losses and costs associated with investing, including total loss of principal, are your responsibility. The views and opinions expressed in this article are those of the authors and do not necessarily reflect the official policy or position of FXStreet nor its advertisers. The author will not be held responsible for information that is found at the end of links posted on this page.
If not otherwise explicitly mentioned in the body of the article, at the time of writing, the author has no position in any stock mentioned in this article and no business relationship with any company mentioned. The author has not received compensation for writing this article, other than from FXStreet.
FXStreet and the author do not provide personalized recommendations. The author makes no representations as to the accuracy, completeness, or suitability of this information. FXStreet and the author will not be liable for any errors, omissions or any losses, injuries or damages arising from this information and its display or use. Errors and omissions excepted.
The author and FXStreet are not registered investment advisors and nothing in this article is intended to be investment advice.
Recommended Content
Editors’ Picks
USD/JPY advances toward 149.50 ahead of crucial BoJ policy decision
USD/JPY is rising toward 149.50 in the Asian session on Tuesday, picking up fresh bids. Traders keenly await the highly-anticipated Bank of Japan policy decision. The BoJ's outlook on the negative interest rate policy and the Yield Curve Control (YCC) will play a key role in influencing the Japanese Yen.
AUD/USD creeps lower to test 0.6550 ahead of RBA’s decision
AUD/USD is grinding lower to test the 0.6550 level in Asian trading on Tuesday. The Aussie Dollar stays on the defensive against the US Dollar as markets prepare for the Reserve Bank of Australia's extended pause but the Bank's rate outlook will hold the key.
Gold awaits Bull Flag confirmation and central banks’ verdicts
Gold price is holding the previous rebounding in Asian trading on Tuesday, as buyers take a breather ahead of the upcoming key central banks’ policy decisions. The US Dollar is stretching higher amid a risk-averse market environment, shrugging off some weakness in the US Treasury bond yields.
Avalanche price could rise 20% on gaming narrative ahead of GDC conference
Avalanche is an outlier on Monday, rallying while the broader market is crashing. It has outperformed Bitcoin price, as well as meme and AI crypto coins, sectors that have been thriving of late.
Australia Interest Rate Decision Preview: RBA set to stand pat after discussing rate hikes in February
The Reserve Bank of Australia is widely expected to hold the Official Cash Rate steady at a 12-year high of 4.35% following the conclusion of its March monetary policy meeting on Tuesday. The decision will be announced at 03:30 GMT.