GBP/USD Forecast: Pound Sterling closes in on key resistance ahead of US jobs data
- GBP/USD recovers above 1.3450 following Thursday's choppy action.
- Investors await August employment data from the US.
- The pair could face a stiff resistance at 1.3480.

After failing to make a decisive move in either direction on Thursday, GBP/USD gathers bullish momentum and trades above 1.3450 in the European session on Friday. The pair faces a strong resistance at 1.3480 as investors await the August labor market data from the United States (US).
Pound Sterling Price This week
The table below shows the percentage change of British Pound (GBP) against listed major currencies this week. British Pound was the weakest against the US Dollar.
| USD | EUR | GBP | JPY | CAD | AUD | NZD | CHF | |
|---|---|---|---|---|---|---|---|---|
| USD | 0.12% | 0.21% | 0.80% | 0.42% | 0.03% | 0.23% | 0.47% | |
| EUR | -0.12% | 0.08% | 0.62% | 0.30% | -0.09% | 0.11% | 0.36% | |
| GBP | -0.21% | -0.08% | 0.44% | 0.22% | -0.17% | 0.03% | 0.32% | |
| JPY | -0.80% | -0.62% | -0.44% | -0.31% | -0.75% | -0.53% | -0.29% | |
| CAD | -0.42% | -0.30% | -0.22% | 0.31% | -0.38% | -0.19% | 0.10% | |
| AUD | -0.03% | 0.09% | 0.17% | 0.75% | 0.38% | 0.20% | 0.49% | |
| NZD | -0.23% | -0.11% | -0.03% | 0.53% | 0.19% | -0.20% | 0.29% | |
| CHF | -0.47% | -0.36% | -0.32% | 0.29% | -0.10% | -0.49% | -0.29% |
The heat map shows percentage changes of major currencies against each other. The base currency is picked from the left column, while the quote currency is picked from the top row. For example, if you pick the British Pound from the left column and move along the horizontal line to the US Dollar, the percentage change displayed in the box will represent GBP (base)/USD (quote).
The US Dollar (USD) struggled to gather strength against its rivals as investors refrained from taking large positions following the mixed macroeconomic data releases. The Institute for Supply Management's (ISM) Services Purchasing Managers' Index (PMI) rose to 52 in August from 50.1 in July, surpassing the market expectation of 51. On the other hand, the Automatic Data Processing's (ADP) monthly report showed that private sector payrolls rose by 54,000 in August. This print missed analysts' estimate of 65,000.
Nonfarm Payrolls (NFP) in the US are expected to increase by 75,000 in August and the Unemployment Rate is seen edging higher to 4.3% from 4.2% in July.
Although the CME FedWatch Tool suggests that markets are nearly fully pricing in a 25 basis-points (bps) rate cut in September, the employment report could still influence the probability of one more rate cut in October, currently at 55%, and drive the USD's valuation.
In case the NFP comes in at or below 50K and feeds into growing fears over worsening conditions in the labor market, the USD could come under heavy selling pressure heading into the weekend and allow GBP/USD to push higher. Conversely, the USD could outperform its rivals on a positive surprise of 100K, or above, and cause the pair to reverse its direction.
GBP/USD Technical Analysis
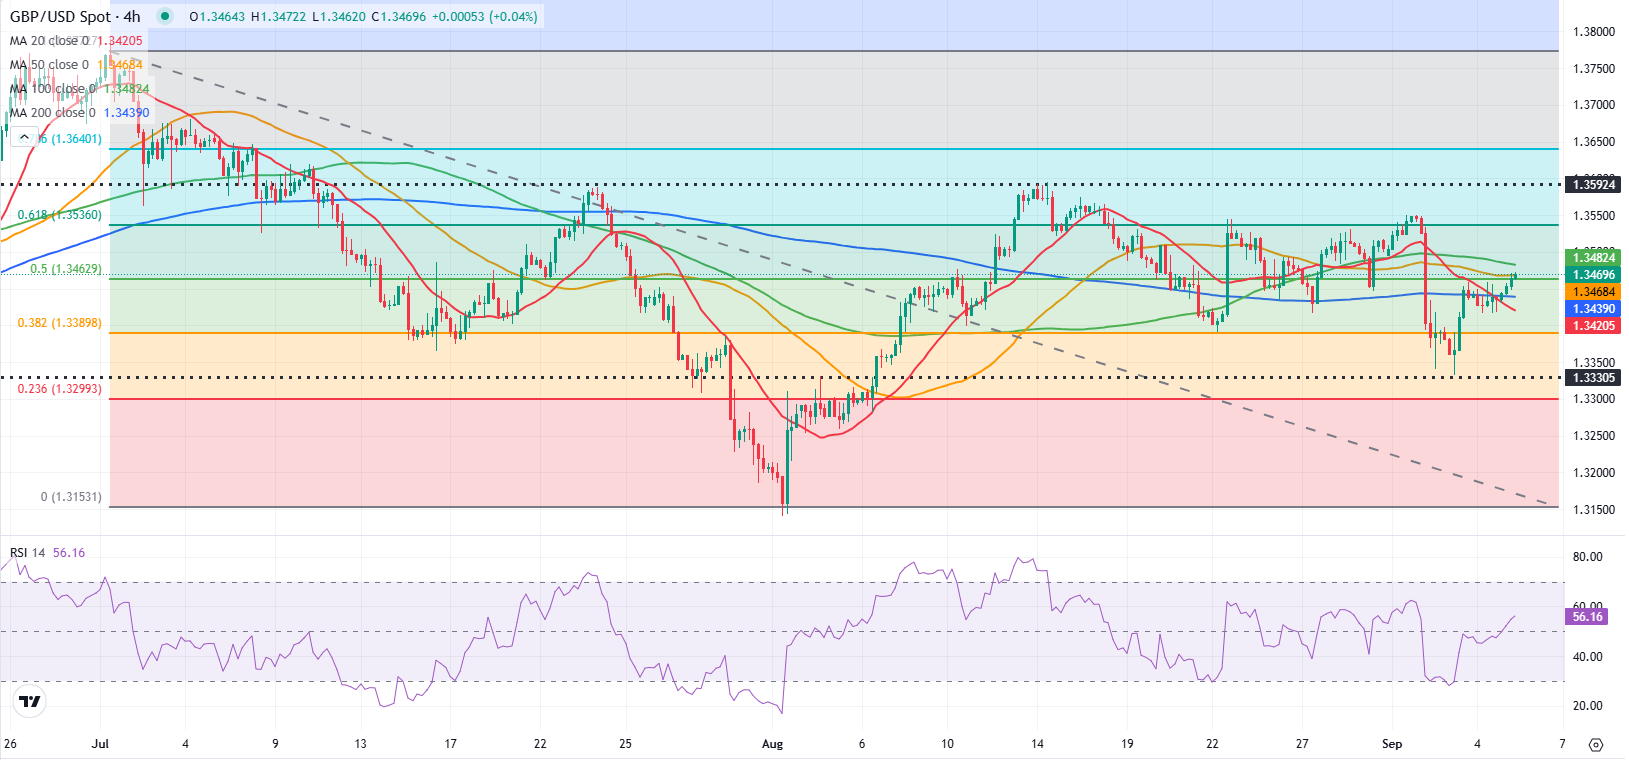
The Relative Strength Index (RSI) indicator on the 4-hour chart rose slightly above 50, reflecting sellers hesitancy.
The 20-day, 50-day and the 100-period Simple Moving Averages (SMAs) converge near 1.3480 to form a strong resistance level. In case GBP/USD manages to clear this hurdle, it could face the next resistance at 1.3540 (Fibonacci 61.8% retracement of the latest downtrend) before 1.3600 (static level, round level).
Looking south, support levels could be spotted at 1.3440 (200-period SMA), 1.3390-1.3400 (Fibonacci 38.2% retracement, round level) and 1.3330 (static level).
GDP FAQs
A country’s Gross Domestic Product (GDP) measures the rate of growth of its economy over a given period of time, usually a quarter. The most reliable figures are those that compare GDP to the previous quarter e.g Q2 of 2023 vs Q1 of 2023, or to the same period in the previous year, e.g Q2 of 2023 vs Q2 of 2022. Annualized quarterly GDP figures extrapolate the growth rate of the quarter as if it were constant for the rest of the year. These can be misleading, however, if temporary shocks impact growth in one quarter but are unlikely to last all year – such as happened in the first quarter of 2020 at the outbreak of the covid pandemic, when growth plummeted.
A higher GDP result is generally positive for a nation’s currency as it reflects a growing economy, which is more likely to produce goods and services that can be exported, as well as attracting higher foreign investment. By the same token, when GDP falls it is usually negative for the currency. When an economy grows people tend to spend more, which leads to inflation. The country’s central bank then has to put up interest rates to combat the inflation with the side effect of attracting more capital inflows from global investors, thus helping the local currency appreciate.
When an economy grows and GDP is rising, people tend to spend more which leads to inflation. The country’s central bank then has to put up interest rates to combat the inflation. Higher interest rates are negative for Gold because they increase the opportunity-cost of holding Gold versus placing the money in a cash deposit account. Therefore, a higher GDP growth rate is usually a bearish factor for Gold price.
Author

Eren Sengezer
FXStreet
As an economist at heart, Eren Sengezer specializes in the assessment of the short-term and long-term impacts of macroeconomic data, central bank policies and political developments on financial assets.