GBP/USD Forecast: Can pound find bottom on a 75 bps BoE hike?
- GBP/USD is trading at its lowest level since 1985 below 1.1250.
- BoE could opt for a bigger-than-expected 75 bps rate hike.
- Fed's hawkish dot plot helps the dollar preserve its strength.

GBP/USD has extended its slide after having suffered large losses on Wednesday and fell to its weakest level since 1985 at 1.1220 early Thursday. The pair seems to have gone into a consolidation phase ahead of the Bank of England's (BoE) interest rate decision but the British pound could find it difficult to stay resilient against the dollar unless the BoE delivers a hawkish surprise.
On Wednesday, the US Federal Reserve announced that it hiked its policy rate by 75 basis points to the range of 3-3.25% as expected. The updated Summary of Economic Projections showed that policymakers' median view of the policy rate by the end of 2023 rose to 4.6% from 3.8% in June's dot plot. By the end of 2024, the policy rate is projected to retreat to 3.9%.
The significant hawkish shift witnessed in the policy outlook provided a boost to the greenback late Wednesday and the US Dollar Index climbed to its strongest level in two decades at 111.80.
The market consensus points to a 50 bps BoE rate hike on Thursday but the futures markets' positioning suggests that a 75 bps hike is very likely. Since there won't be a press conference following the rate announcement, market participants will pay close attention to the vote split. In case the BoE hikes the policy rate by 75 bps but the vote split stands at 5-4, the British pound could have a hard time finding demand. A unanimous vote in favour of a 75 bps hike could provide a boost to the sterling and open the door to a steady rebound in GBP/USD.
BOE Interest Rate Decision Preview: GBP/USD braces for volatility storm, eyeing a 75 bps hike.
In the second half of the day, the weekly Initial Jobless Claims data will be featured in the US economic docket. After the BoE dust settles, market participants are likely to keep an eye on US stocks. If Wall Street's main indexes decline sharply after the opening bell, the dollar should be able to continue to outperform its rivals and vice versa.
GBP/USD Technical Analysis
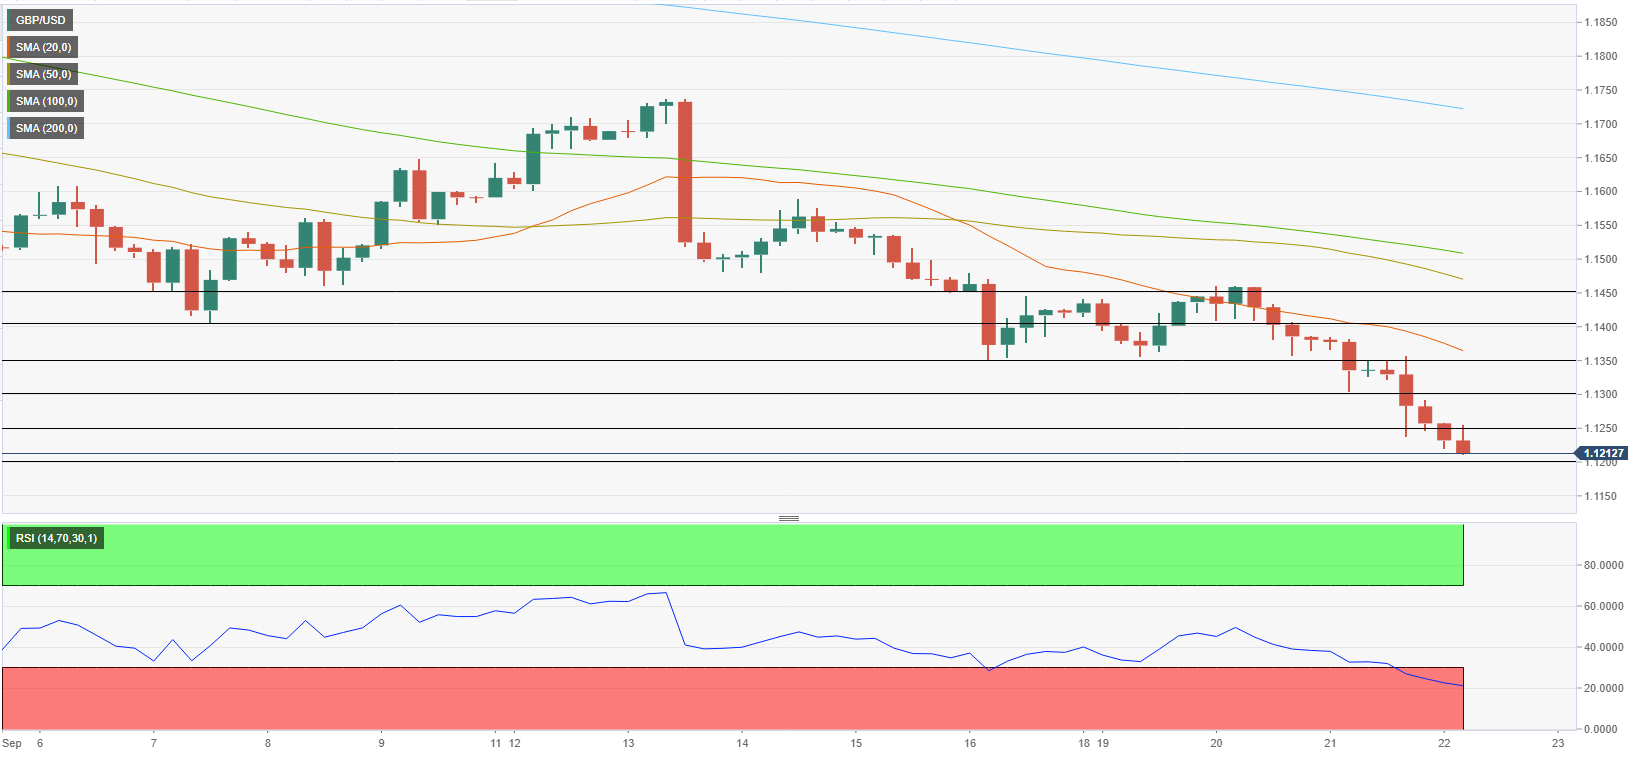
The Relative Strength Index (RSI) indicator on the four-hour chart stays well below 30, pointing to extremely oversold conditions in the pair. Unless the BoE delivers a hawkish surprise as mentioned above, however, market participants are likely to ignore the technical conditions for the time being.
Interim support seems to have formed at 1.1220 (static level) before 1.1200 (psychological level) and 1.1100 (psychological level).
On the upside, initial resistance is located at 1.1250 (former support) ahead of 1.1300 (psychological level) and 1.1350 (static level, 20-period SMA).
Premium
You have reached your limit of 3 free articles for this month.
Start your subscription and get access to all our original articles.
Author

Eren Sengezer
FXStreet
As an economist at heart, Eren Sengezer specializes in the assessment of the short-term and long-term impacts of macroeconomic data, central bank policies and political developments on financial assets.


