GBP/USD Forecast: Buyers remain hesitant as key resistance stays intact
- GBP/USD has been struggling to find direction early Thursday.
- Dollar holds its ground after suffering heavy losses earlier in the week.
- February US PCE inflation data could impact market pricing of a 50 bps Fed hike in May.

GBP/USD has snapped a five-day losing streak on Wednesday but has been having a difficult time making a decisive move in either direction early Thursday. Although the near-term technical outlook points to a neutral bias, the pair's failure to clear the 1.3160 resistance could be seen as a bearish sign.
The selling pressure surrounding the greenback allowed GBP/USD to edge higher on Wednesday but the negative shift witnessed in risk sentiment in the second half of the day forced the pair to turn south. The latest headlines surrounding the Russia-Ukraine conflict suggested that sides were not as close to finding a diplomatic solution as officials' comments suggested following Tuesday's negotiations.
The cautious market environment, as reflected by the small losses in the UK's FTSE 100 Index, in the early European session is not allowing the British pound to attract investors.
In the second half of the day, the Personal Consumption Expenditures (PCE) Price Index data from the US will be watched closely by market participants. The CME Group FedWatch Tool's probability of a 50 basis points rate hike in May currently stands at 64%, down from 70% earlier in the week. Unless the data unveils a surprising slowdown in PCE inflation, investors could continue to price an aggressive policy tightening and help the dollar regain its strength.
GBP/USD Technical Analysis
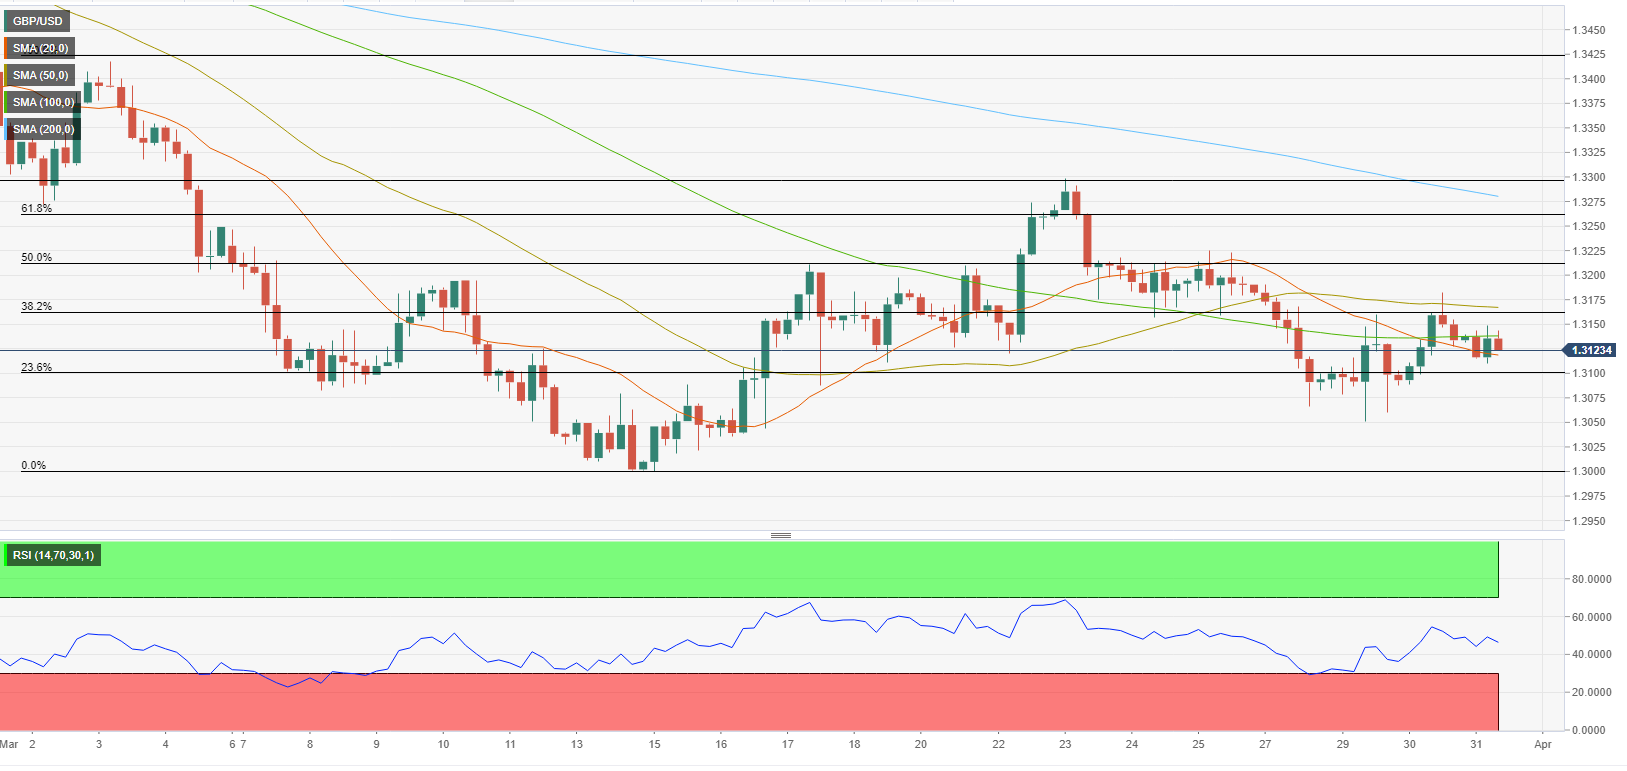
GBP/USD faces stiff resistance at 1.3160 (Fibonacci 38.2% retracement of the latest downtrend, 50-period SMA). In case the pair makes a four-hour close above that level and starts using it as support, buyers could show interest. 1.3200 (psychological level, Fibonacci 50% retracement) and 1.3260 (Fibonacci 61.8% retracement) align as next bullish targets.
On the downside, the first support is located at 1.3100 (psychological level, Fibonacci 23.6% retracement) ahead of 1.3050 (static level).
Meanwhile, GBP/USD trades slightly below the 100-period SMA on the four-hour chart and the Relative Strength Index (RSI) indicator edges lower, confirming buyers' hesitancy.
Premium
You have reached your limit of 3 free articles for this month.
Start your subscription and get access to all our original articles.
Author

Eren Sengezer
FXStreet
As an economist at heart, Eren Sengezer specializes in the assessment of the short-term and long-term impacts of macroeconomic data, central bank policies and political developments on financial assets.


