GBP/USD Forecast: 1.2550 aligns as next bearish target
- GBP/USD has lost its traction and retreated to the 1.2600 area.
- The pair could extend correction in case mood continues to sour.
- The lower limit of the ascending regression channel aligns as next bearish target.

GBP/USD has reversed its direction and declined to the 1.2600 area in the European morning on Tuesday after having touched its highest level in nearly a year at 1.2670 on Monday. The pair's near-term technical outlook suggests that the downward correction could continue in the near term.
Markets remain cautious early Tuesday with the UK's FTSE 100 Index trading modestly lower on the day following a three-day weekend. Furthermore, US stock index futures are down nearly 0.4%, pointing to a negative opening in Wall Street's main indexes.
In case safe-haven flows continue to dominate the action in the second half of the day, the US Dollar should be able to hold its ground. In the absence of high-impact data releases, the risk perception is likely to remain as the primary market driver.
Nevertheless, ahead of the April inflation report from the US on Wednesday and the Bank of England's (BoE) highly-anticipated rate decision on Thursday, investors could opt to move to the sidelines, causing GBP/USD's action to turn subdued.
During the American trading hours, NY Fed President John Williams and Fed Governor Philip Jefferson will be delivering speeches. Markets remain fairly certain that the US Federal Reserve (Fed) will leave its policy unchanged in June after the Fed's survey confirmed on Monday that banks reported tighter standards and weaker demand for commercial and industrial loans in the first quarter. Although the USD is likely to gather strength on hawkish comments, the Fed's data-dependent approach suggests that inflation figures are likely to have a more significant impact on the Fed's rate outlook. Hence, the market reaction to Fedspeak could remain short-lived.
GBP/USD Technical Analysis
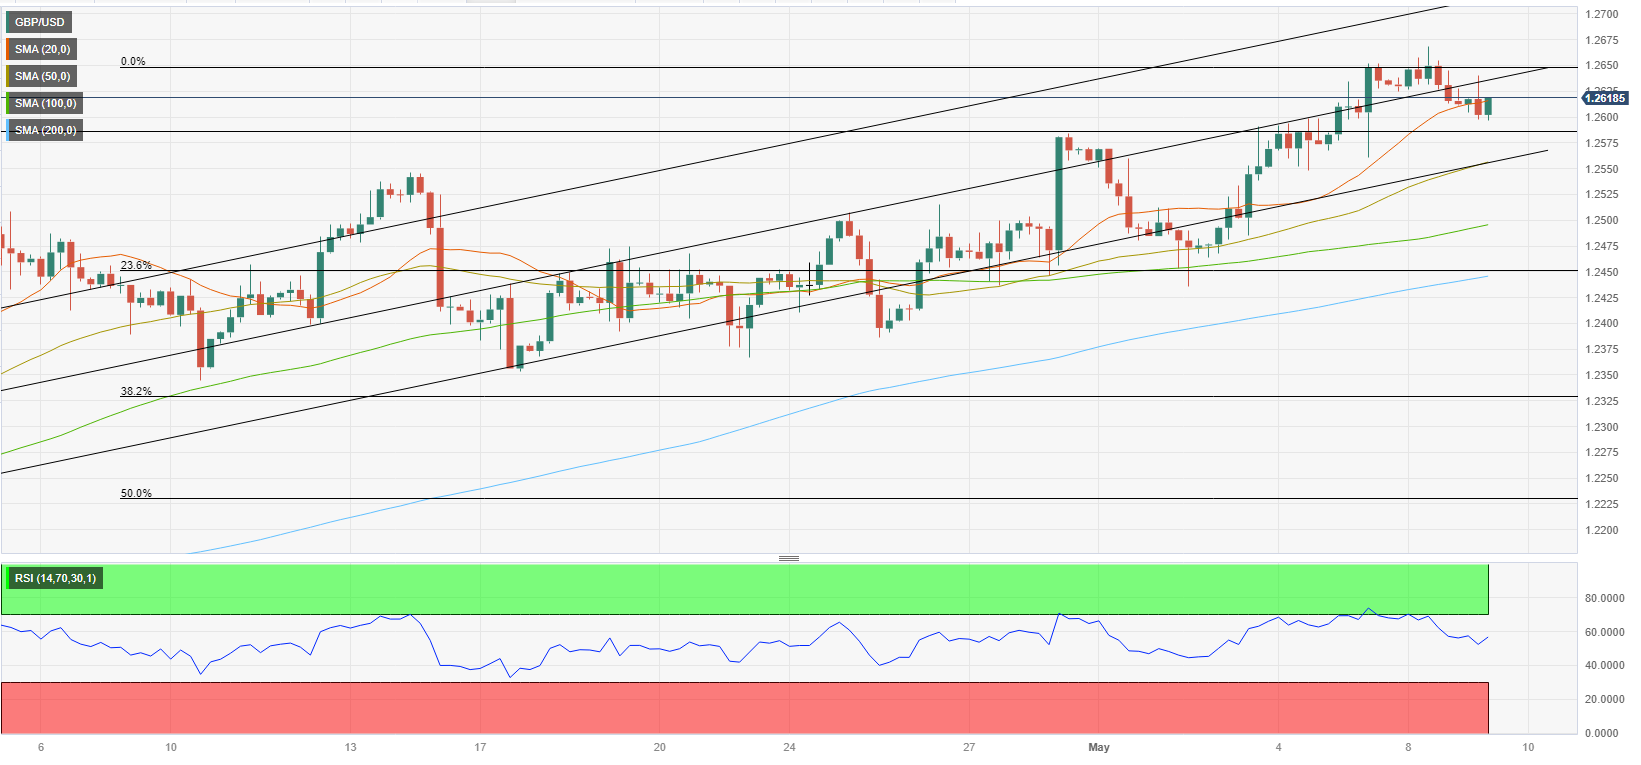
GBP/USD fell into the lower half of the ascending channel coming from mid-March on Tuesday and the Relative Strength Index (RSI) indicator on the four-hour chart retreated to 50, reflecting the lack of buyer interest.
On the downside, 1.2550 (50-period Simple Moving Average (SMA), lower limit of the ascending channel) aligns as key support. A four-hour close below that level could attract sellers and open the door for additional losses toward 1.2500.
In case GBP/USD rises above 1.2630 (mid-point of the ascending channel), 1.2650 (static level) aligns as immediate resistance ahead of 1.2670 (Monday high) and 1.2700 (psychological level, upper-limit of the ascending channel).
Premium
You have reached your limit of 3 free articles for this month.
Start your subscription and get access to all our original articles.
Author

Eren Sengezer
FXStreet
As an economist at heart, Eren Sengezer specializes in the assessment of the short-term and long-term impacts of macroeconomic data, central bank policies and political developments on financial assets.


