|

GBP/USD extends sideways pattern between SMAs

GBPUSD has been edging higher since September when it found its feet at the all-time low of 1.0324. However, this latest rebound seems to be fading after being rejected twice at the 1.2445 region, with the price remaining stuck in a tight range formed by its 50- and 200-day simple moving averages (SMAs).

Despite the pair’s rangebound pattern, the short-term oscillators are indicating that near-term risks remain tilted to the downside. Specifically, the RSI is pointing downwards after failing to cross above the 50-neutral mark, while the MACD histogram is currently below both zero and its red signal line.

To the downside, the congested region that includes the 200-day SMA and the recent low of 1.1914, which has rejected further declines three times in the past two weeks, could act as the first line of defence. Should that floor collapse, the price might test the January low of 1.1840. Even lower, further declines could cease at the October resistance of 1.1645, which could act as support in the future

GBPUSD

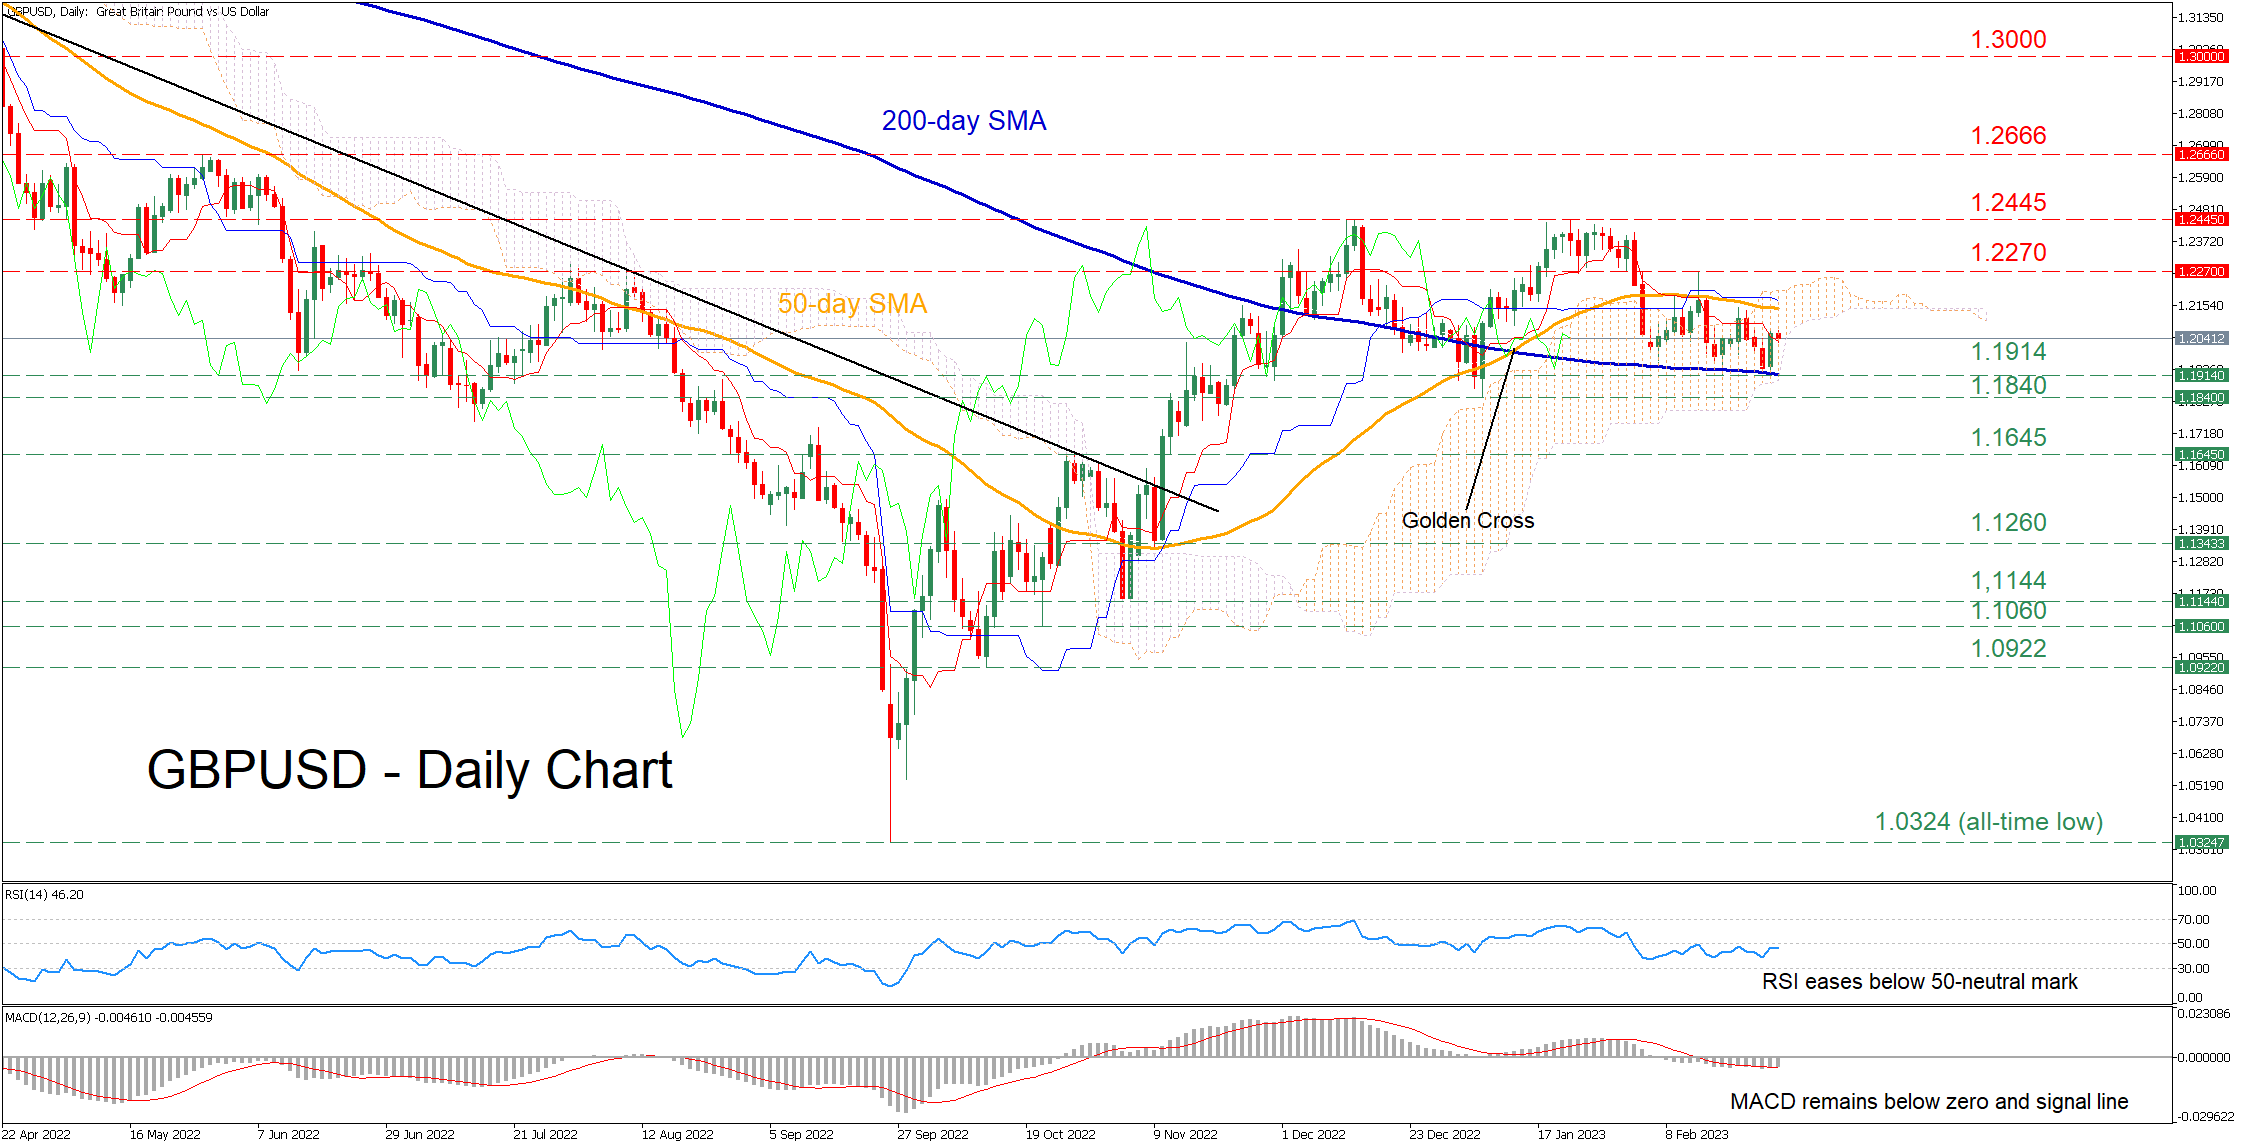
Alternatively, should buyers re-emerge and push the price above its 50-day SMA, initial resistance could be found at the recent peak of 1.2270. Breaking above that zone, the price may ascend to test the crucial 1.2445 territory, which capped the pair’s upside twice in the past three months. A break above that zone could turn the spotlight to the May high of 1.2666.

In brief, GBPUSD continues to fluctuate within a tight trading zone, with its 50- and 200-day SMAs acting as an upper and a lower limit, respectively. Therefore, a break above or below this sideways pattern is likely to be followed by a significant move in the same direction.

Author

Stefanos Oikonomidis

Stefanos joined XM as a Junior Investment Analyst in September 2021. He conducts daily market research on the currency, commodity and equity markets, from a fundamental and a technical perspective.

More from Stefanos Oikonomidis
Share:

Editor's Picks

EUR/USD hits two-day highs near 1.1820

EUR/USD picks up pace and reaches two-day tops around 1.1820 at the end of the week. The pair’s move higher comes on the back of renewed weakness in the US Dollar amid growing talk that the Fed could deliver an interest rate cut as early as March. On the docket, the flash US Consumer Sentiment improves to 57.3 in February.

GBP/USD reclaims 1.3600 and above

GBP/USD reverses two straight days of losses, surpassing the key 1.3600 yardstick on Friday. Cable’s rebound comes as the Greenback slips away from two-week highs in response to some profit-taking mood and speculation of Fed rate cuts. In addition, hawkish comments from the BoE’s Pill are also collaborating with the quid’s improvement.

Gold climbs further, focus is back to 45,000

Gold regains upside traction and surpasses the $4,900 mark per troy ounce at the end of the week, shifting its attention to the critical $5,000 region. The move reflects a shift in risk sentiment, driving flows back towards traditional safe haven assets and supporting the yellow metal.

Crypto Today: Bitcoin, Ethereum, XRP rebound amid risk-off, $2.6 billion liquidation wave

Bitcoin edges up above $65,000 at the time of writing on Friday, as dust from the recent macro-triggered sell-off settles. The leading altcoin, Ethereum, hovers above $1,900, but resistance at $2,000 caps the upside. Meanwhile, Ripple has recorded the largest intraday jump among the three assets, up over 10% to $1.35.

Three scenarios for Japanese Yen ahead of snap election

The latest polls point to a dominant win for the ruling bloc at the upcoming Japanese snap election. The larger Sanae Takaichi’s mandate, the more investors fear faster implementation of tax cuts and spending plans. 

XRP rally extends as modest ETF inflows support recovery

Ripple is accelerating its recovery, trading above $1.36 at the time of writing on Friday, as investors adjust their positions following a turbulent week in the broader crypto market. The remittance token is up over 21% from its intraday low of $1.12.