GBP/USD – Expanding Wedge offers an upside bias
Technical
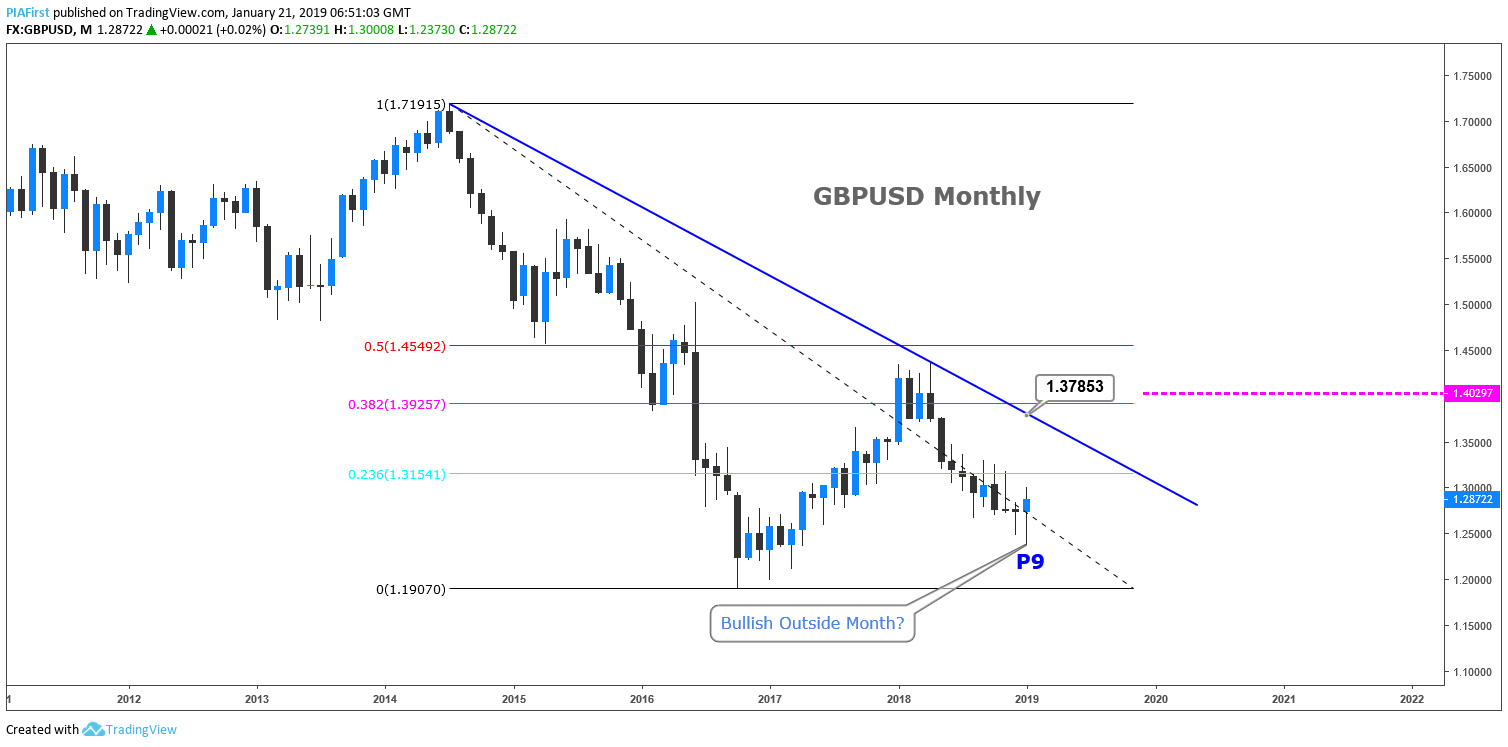
Monthly: Moved higher from the 2016 low of 1.1905. Levels close to be bespoke resistance at 1.4390 found sellers. The price action from April 2018 formed a bearish Outside Bar, often an indication that the rally (correction) has come to an end. For the last seven months we have seen spikes in both directions highlighting indecision. This month posted a DeMark Perfected 9 count, indicating that we should see a correction to the upside. Trend of lower highs is seen at 1.3785, bespoke resistance at 1.4020.
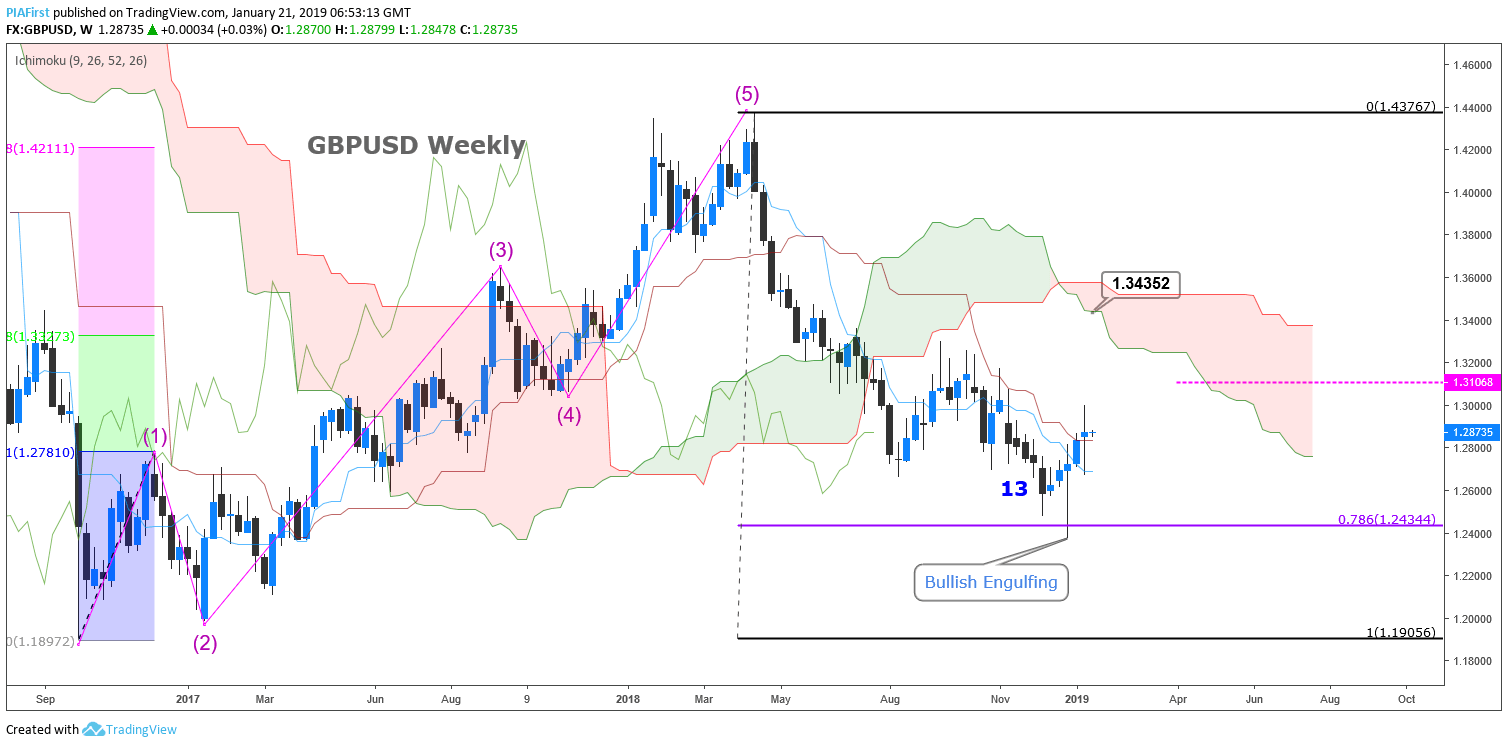
Weekly: A 5-wave pattern was completed at 1.4377 (Elliott Wave). Levels close to the 78.6% pullback of 1.2449 (from 1.1905 – 1.4377) found buyers. Last week’s price action posted a bullish Outside Week, often an indication that the move lower has come to an end. We have a DeMark exhaustion 13 on the week 18/11/2018. Bespoke resistance is seen at 1.3105. Buying from current levels offers poor risk/reward.
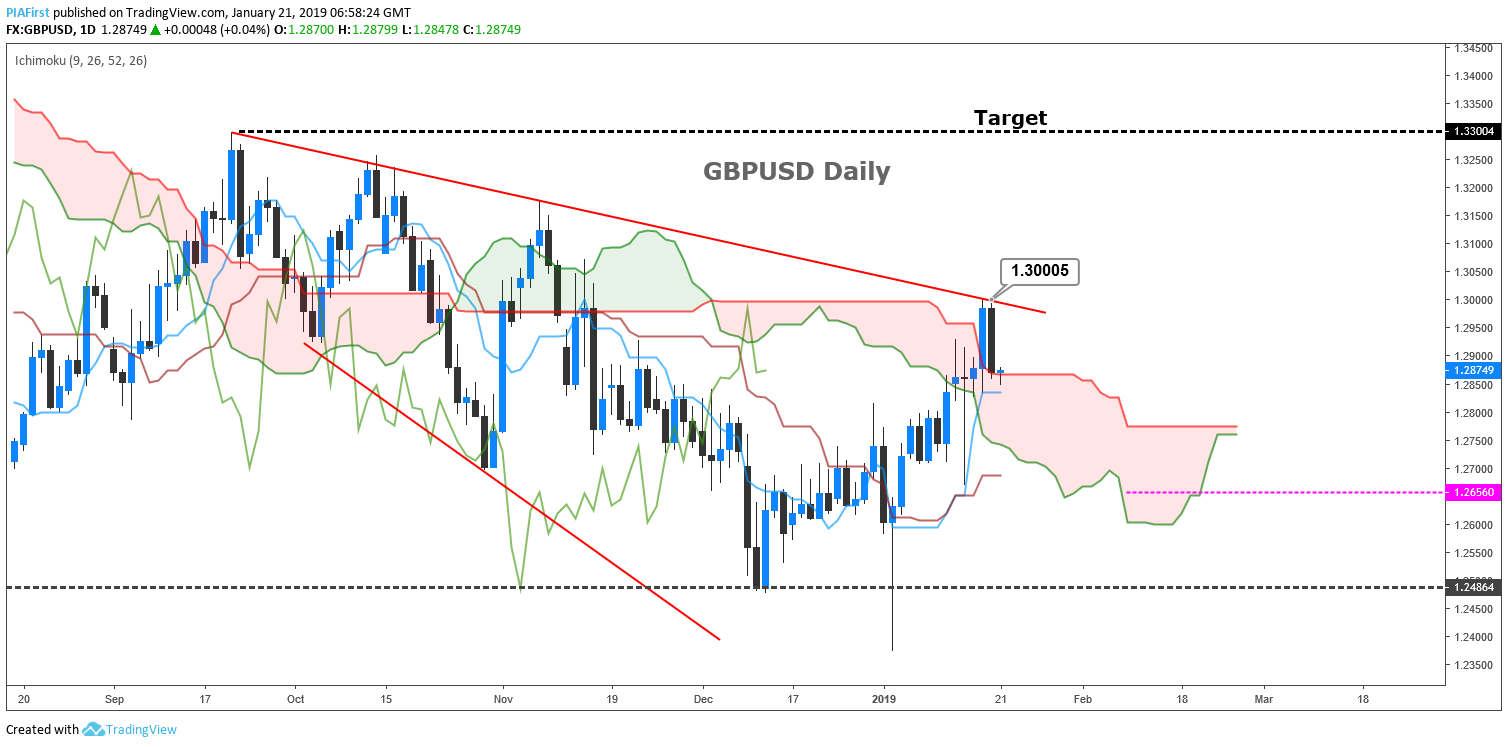
Daily: Mixed trading for the last 84 days has resulted in an Expending Wedge formation being posted on the daily chart. This has an eventual bias to break to the upside. He measured move target on a break of 1.3000 is 1.3300. We look to buy dips.
-
We look to Buy at: 1.2670
-
Stop: 1.2520
-
Target: 1.3300 and 1.3750
Author

Ian Coleman
FXStreet
Ian started his financial career at the age of 18 working as a Junior Swiss Broker at Godsell Astley and Pearce (London). He quickly moved through the ranks and was Desk Manager at RP Martins at the age of 29.


