GBP/USD Breaks Uptrend Channel and Starts Expected Wave B

Meta description:
GBP/USD broke below the support trend line of the uptrend channel, which is probably indicating the end of the larger bullish momentum.
The GBP/USD broke below the support trend line (dotted blue) of the uptrend channel. The bearish breakout is probably indicating the end of the larger bullish momentum (wave A blue).
GBP/USD
4 hour
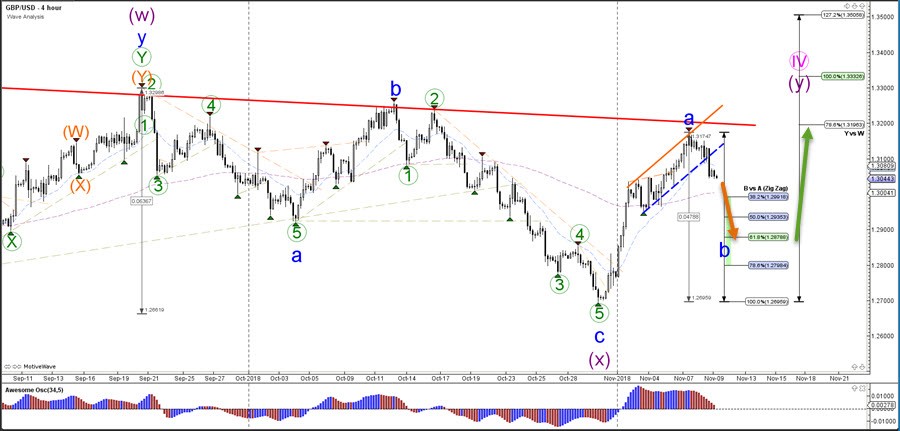
The GBP/USD is moving lower as part of a waveB (blue) and price is expected to use the Fibonacci levels of wave B vs A as a potential support and bouncing spot. A break below the 100% Fib invalidates the bullish ABC zigzag.
1 hour
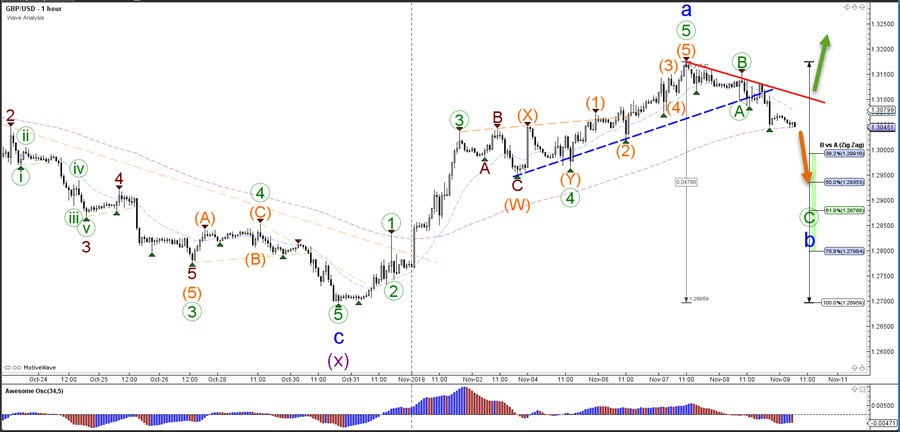
The GBP/USD is expected to build an ABC zigzag wave pattern back to theFibonacci levels of wave B vs Awhich in turn could act as a support zone. Price could build an expanded WXY correction after completing the ABC within wave B (blue). A bullish breakout above the resistance trend line (red) indicates more upside.
Author

Chris Svorcik
Elite CurrenSea
Experience Chris Svorcik has co-founded Elite CurrenSea in 2014 together with Nenad Kerkez, aka Tarantula FX. Chris is a technical analyst, wave analyst, trader, writer, educator, webinar speaker, and seminar speaker of the financial markets.


