GBP/AUD Elliott Wave technical analysis [Video]
![GBP/AUD Elliott Wave technical analysis [Video]](https://editorial.fxstreet.com/images/Markets/Currencies/Majors/GBPUSD/british-currency-coins-and-notes-14982194.jpg)
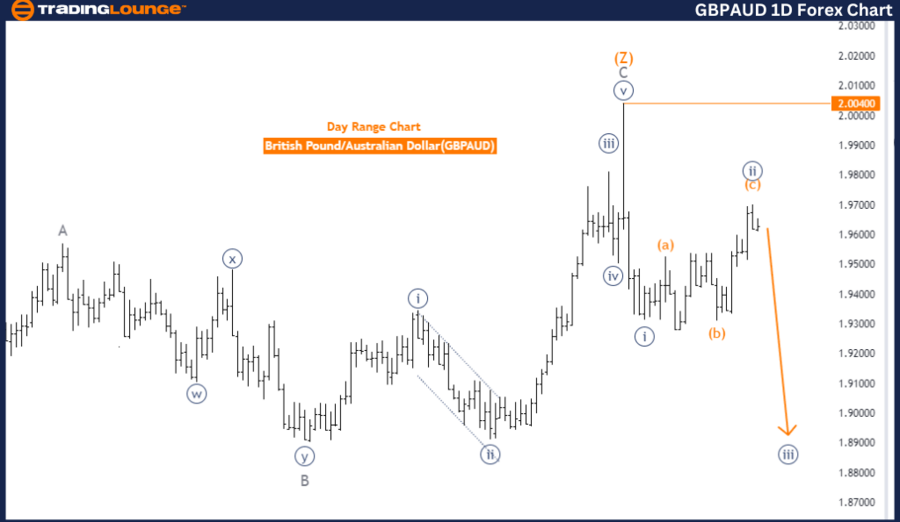
GBP/AUD Elliott Wave analysis - Daily chart overview
GBP/AUD Elliott Wave technical analysis
-
Trend: Bearish.
-
Mode: Impulsive.
-
Structure: Navy blue wave 3.
-
Position: Gray wave 1.
-
Next direction: Lower levels, navy blue wave 3 in progress.
-
Wave cancellation invalid level: 2.00400.
Analysis breakdown
The GBPAUD Elliott Wave analysis on the daily chart indicates a bearish trend. The current mode of the market is impulsive, suggesting strong downward price movement. The structure being tracked is navy blue wave 3, which indicates continued downward momentum aligning with the overall trend.
At this point, the pair is positioned within gray wave 1, which is a part of the larger navy blue wave 3 that has already started. This suggests that the market is in the early stages of a downward impulsive wave, with further declines expected as the wave unfolds.
The analysis suggests that navy blue wave 2, a corrective phase, appears to be completed. With the conclusion of this corrective wave, navy blue wave 3 has now taken over, marking the resumption of the larger bearish trend. As this wave progresses, the price is expected to continue moving lower, further reinforcing the broader downtrend.
Moreover, a wave cancellation invalid level is provided at 2.00400. If the price rises above this level, the current Elliott Wave structure and the bearish forecast would be invalidated, necessitating a re-evaluation of the market outlook. However, as long as the price stays below this level, the downtrend remains intact, and further declines are expected as part of navy blue wave 3.
Summary
The GBPAUD daily chart analysis reveals a strong bearish trend with the impulsive navy blue wave 3 currently unfolding. The completion of navy blue wave 2 signals a return to a downward move, and as long as the price stays below the invalidation level of 2.00400, the bearish outlook remains in place.
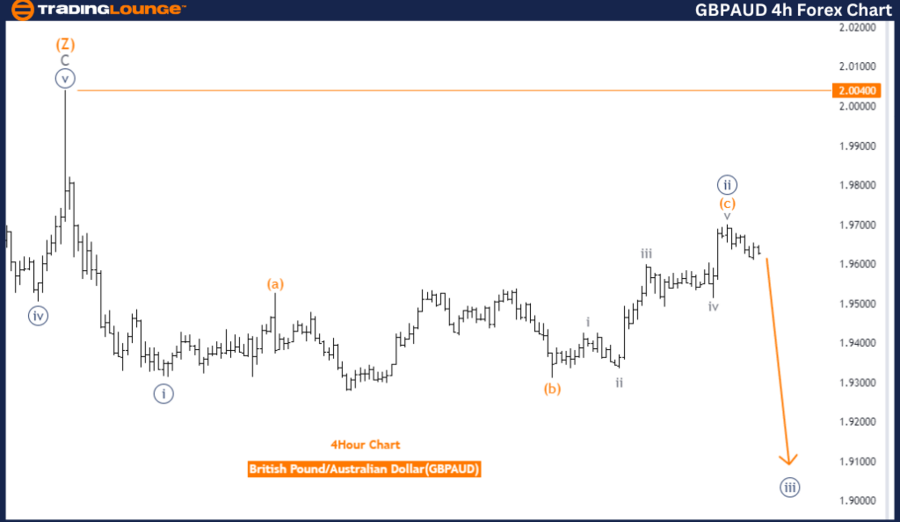
GBP/AUD Elliott Wave analysis – Four-hour chart overview
-
Trend: Bearish.
-
Mode: Impulsive.
-
Structure: Navy blue wave 3.
-
Position: Gray wave 1
-
Next direction: Lower levels, navy blue wave 3 in progress.
-
Wave cancellation invalid level: 2.00400.
Analysis breakdown
The GBPAUD Elliott Wave analysis on the 4-hour chart indicates a bearish trend. The market is in an impulsive mode, which signals strong downward momentum. The current structure being tracked is navy blue wave 3, which points to further downside movement in alignment with the broader bearish trend.
The market is currently positioned in gray wave 1, a part of the larger navy blue wave 3 that has already started. This suggests that the market is within the early phases of a downward impulsive wave, with additional price declines expected as the wave continues to unfold.
The completion of navy blue wave 2, which was a corrective phase, has paved the way for navy blue wave 3 to take over. This shift marks the start of a new downward impulsive movement, expected to push prices further down as part of the overall trend.
The analysis also highlights a wave cancellation invalid level at 2.00400. If the price rises above this level, the current Elliott Wave count would become invalid, requiring a re-evaluation of the market outlook. However, if the price remains below this level, the bearish trend will likely continue, and further downside movement can be expected within navy blue wave 3.
Summary
The GBPAUD 4-hour chart shows a strong bearish trend, with navy blue wave 3 currently unfolding. The completion of navy blue wave 2 signals the beginning of a new downward impulsive wave. As long as the price stays below the invalidation level of 2.00400, the bearish outlook remains intact, with continued downside movement expected.
GBP/AUD Elliott Wave technical analysis [Video]
Author

Peter Mathers
TradingLounge
Peter Mathers started actively trading in 1982. He began his career at Hoei and Shoin, a Japanese futures trading company.


