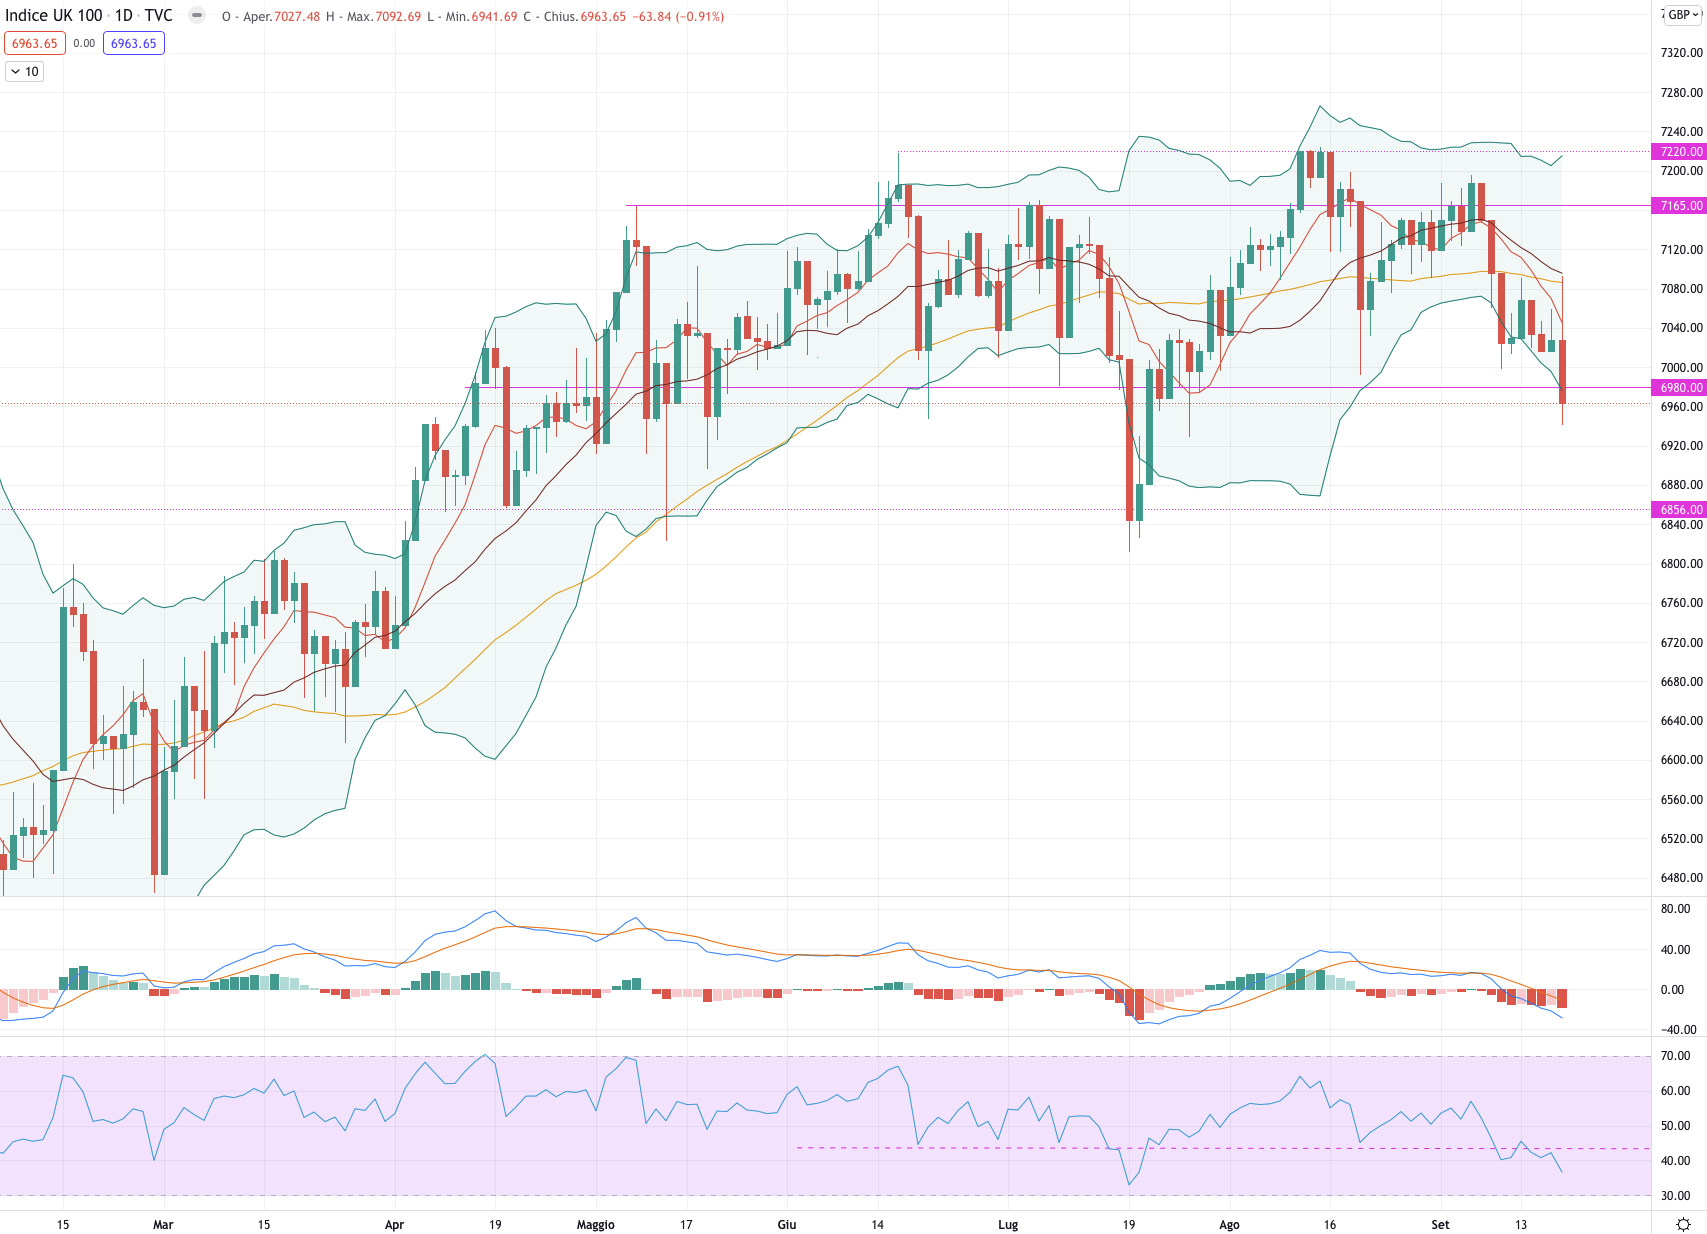
FTSE 100 could go to test the intermediate resistance at 6.930
FTSE 100 (#UKX)
The FTSE 100 ended the week down -1.69%.
For the week ahead, the index could test the intermediate support at 6.930 and then reverse to the upside.
Indicators
This week the FTSE respected the bear flag setup and managed to break out of the 7,000 level.
For the week ahead, the index could go to test the intermediate resistance at 6.930 and then reverse to the upside.
MACD crossed to the downside reflecting the negative momentum of the index and the RSI, rejected once again at 44, is pointing downwards.
Should the index break further the level of 6,930, we will expect a similar swings in depth and speed to that of July 19th: a quick head to 6,856 and then reversing vigorously to the upside.
Support at 6,856.
Resistance at 6.980.
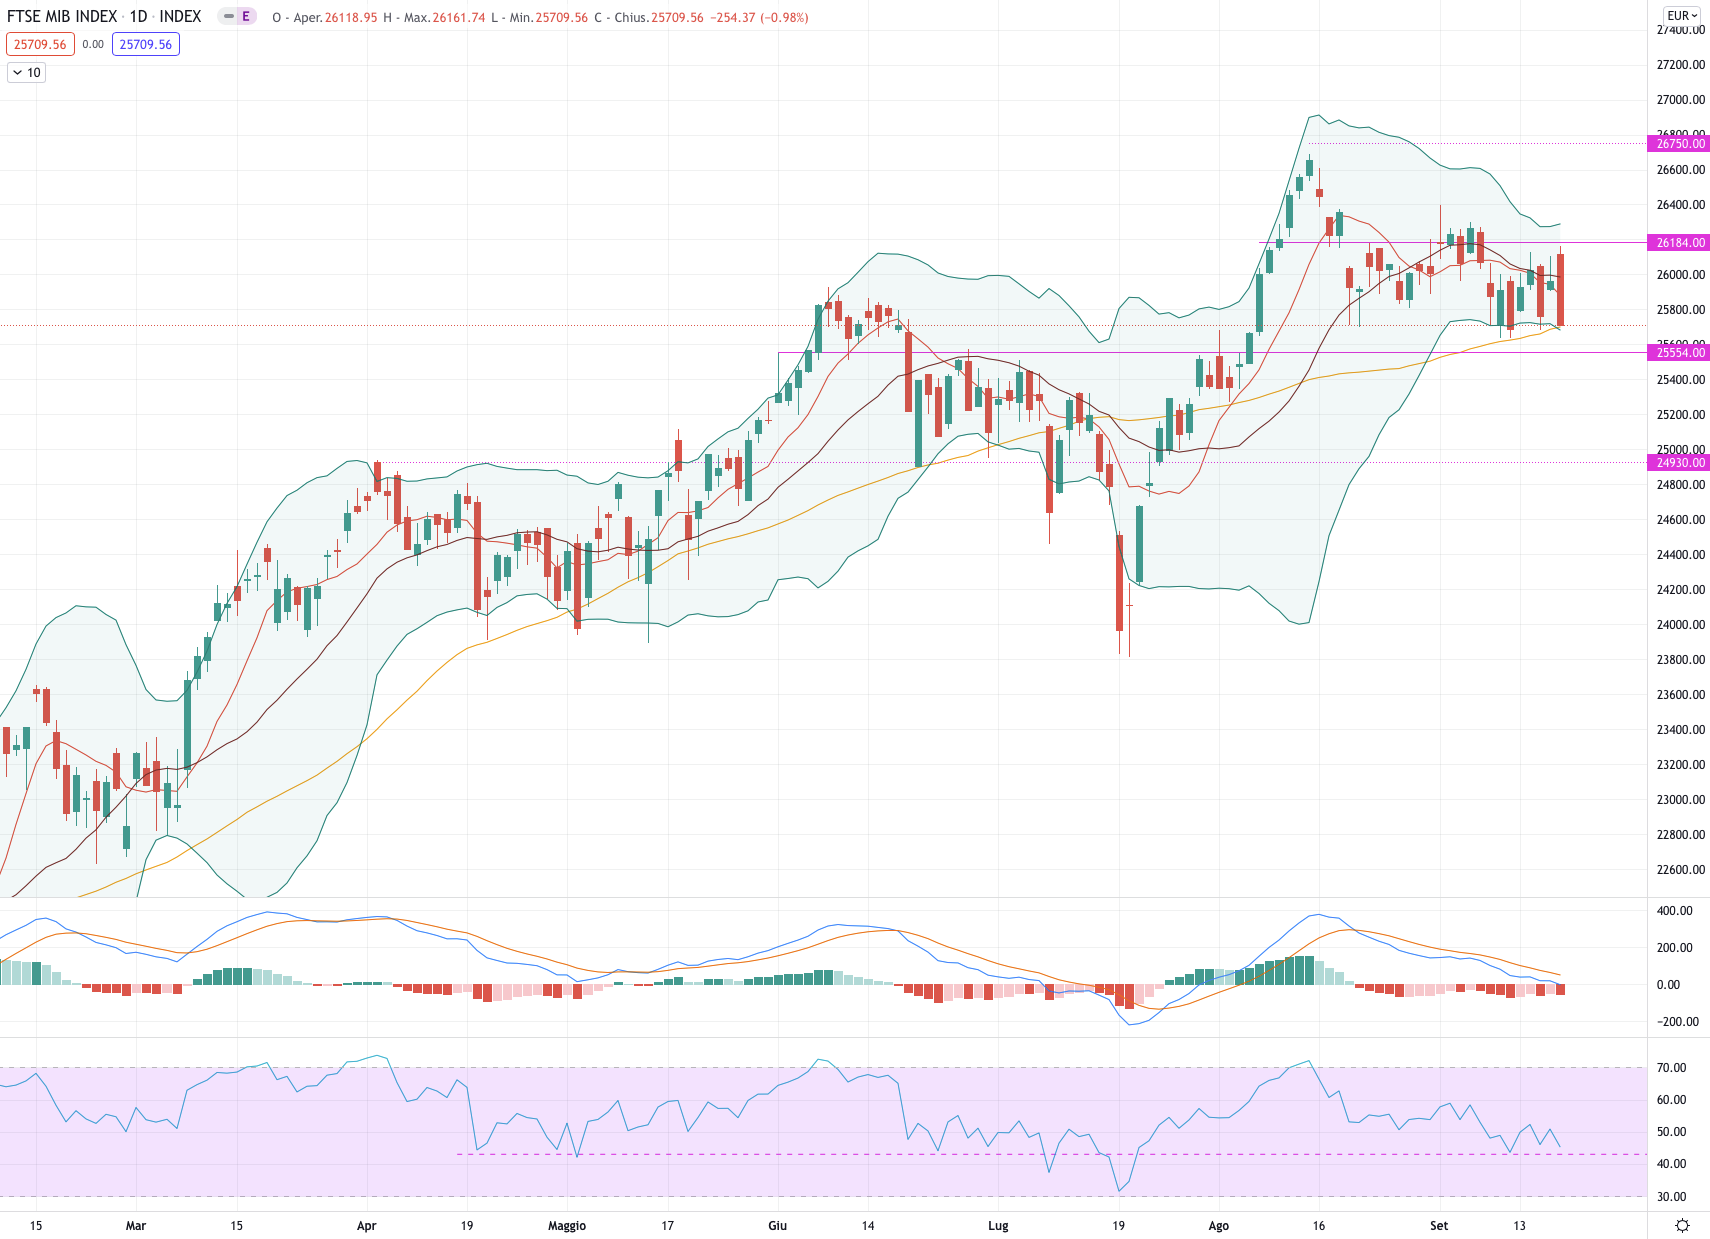
FTSEMIB (#FTSEMIB)
The FTSEMIB had a week down -0.42%.
For the week, we expect a consolidation of between 25,700 and 26,000.
Indicators
This week the 50MA once again acted as support. Friday's strong bearish candlestick could anticipate a continued downside to the start of the week.
MACD is about to cross to the downside along with a RSI which appears to breaking the 43.00 support level.
Breaking one of the two levels 25.700 - 26.000 could lead to more swings. A possible drop to 25,200 would offer a good entry point for long positions
Support at 25,554.
Resistance at 26.184.
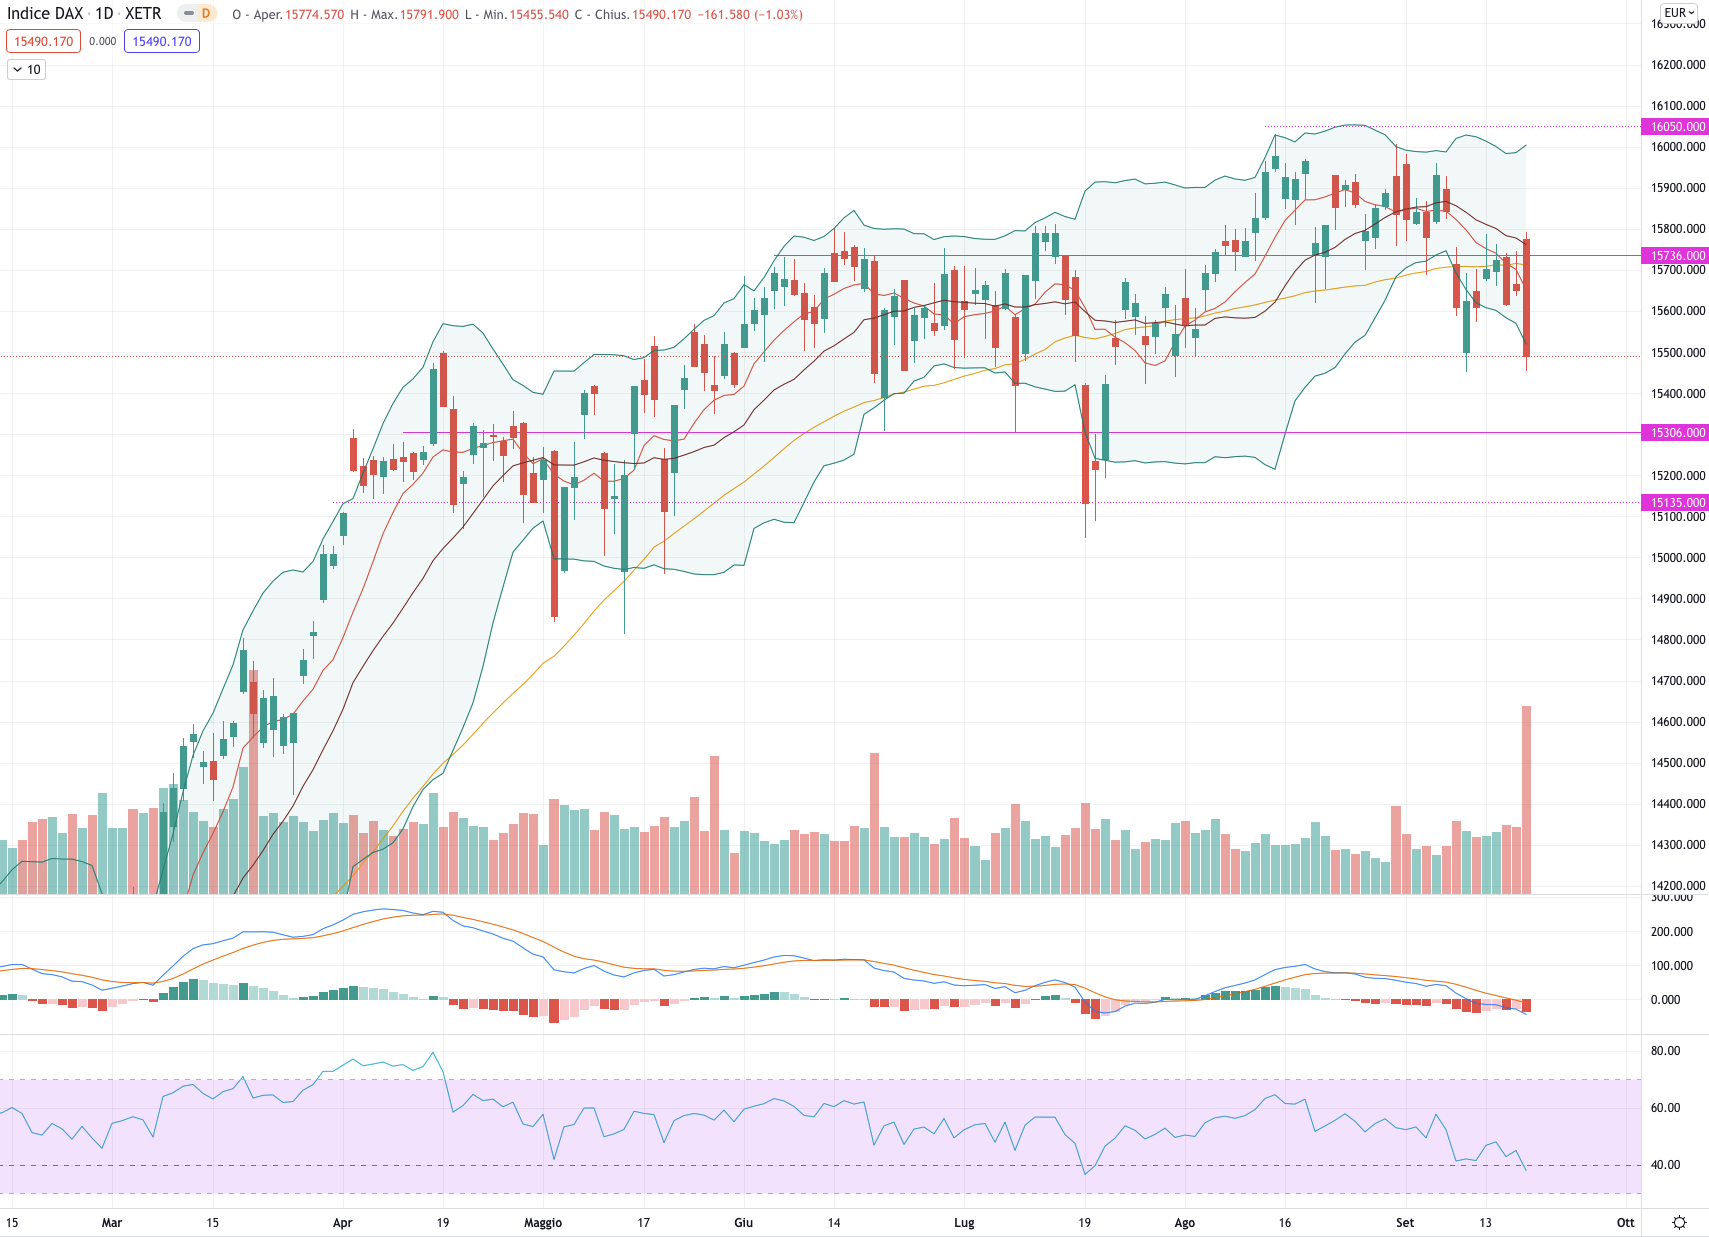
DAX (#DAX)
The DAX ended the week down -1.58%.
For the week ahead, the price could test 15.306 and then reverse to the upside.
Indicators
The DAX managed to test the resistance at 15,736 and then continue to fall.
Given the strong bearish candle on Friday, the index could continue selling in the first part of the week with also a possible test of the support area.
MACD is crossing to the downside and the RSI has broken the support level at 40: this could lead the index to test the support and then reverse to the upside.
The DAX trend is still upward but we believe the retracement in progress is physiological in order to be able to continue upward.
Support at 15,306.
Resistance at 15,736.
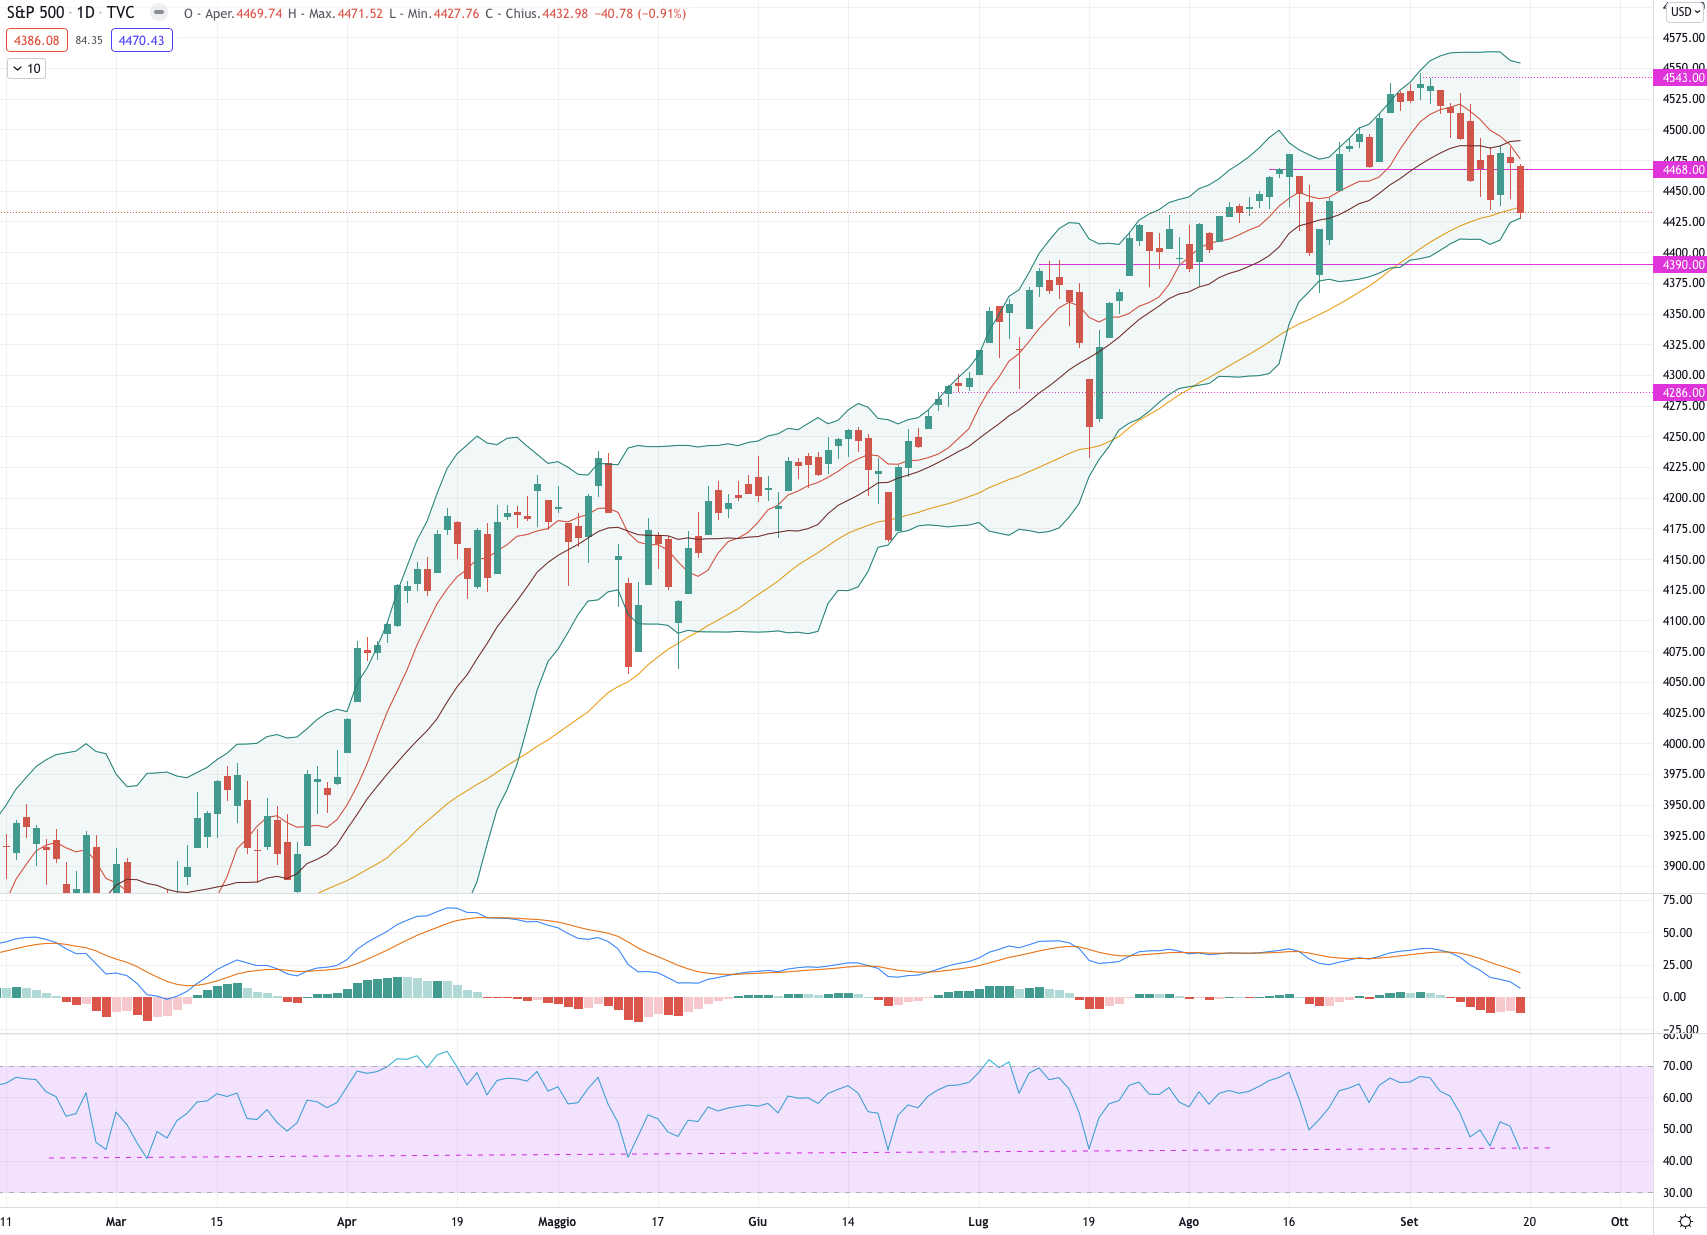
S&P 500 (#SPX)
The S&P 500 had a week down by -1.20%.
We believe the index could test 4,390 for the coming week.
Indicators
The index rebounded this week on the 50MA and then returned to it on Friday: the setup looks very similar to that of a bear flag, which could therefore lead to a further decline in the coming days.
MACD is continuing to fall but we do not believe it can exceed the 0 threshold, while the RSI is testing again the 43.00 level: strong support from January 2021.
A possible retracement to 4.390 would offer an excellent opportunity for a long position
Support at 4.390.
Resistance at 4.468.
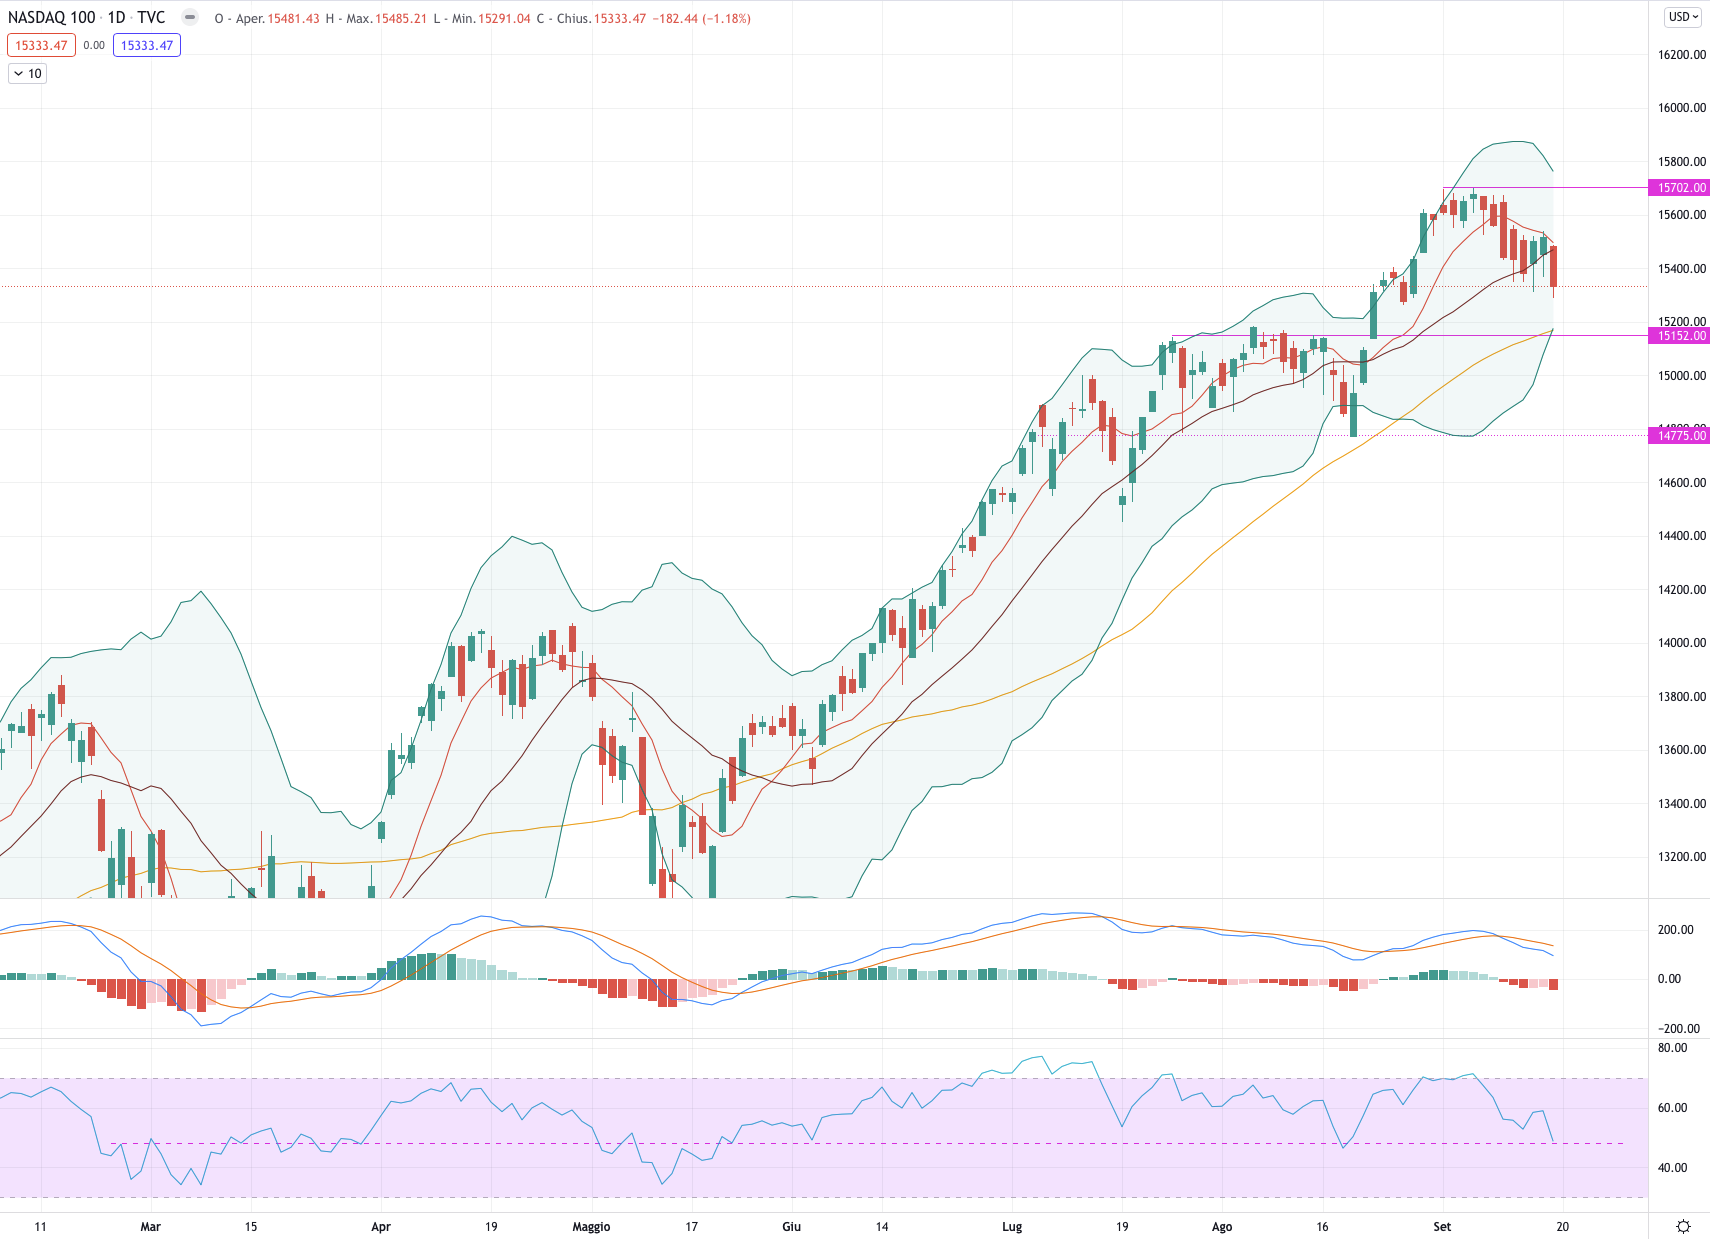
Nasdaq 100 (#NDX)
The NASDAQ ended the week down -1.33%.
For the coming week, the index could continue down to 15,200.
Indicators
We believe NASDAQ has now started a retracement to the strong support area at 15,200.
MACD and RSI are both pointing downwards with the last one backtesting the 60 level and then continuing downwards.
On Friday, the index closed again below the 9MA and we are confident on a drop to at least the 50MA.
Support for 15.152.
Resistance at 15,702.
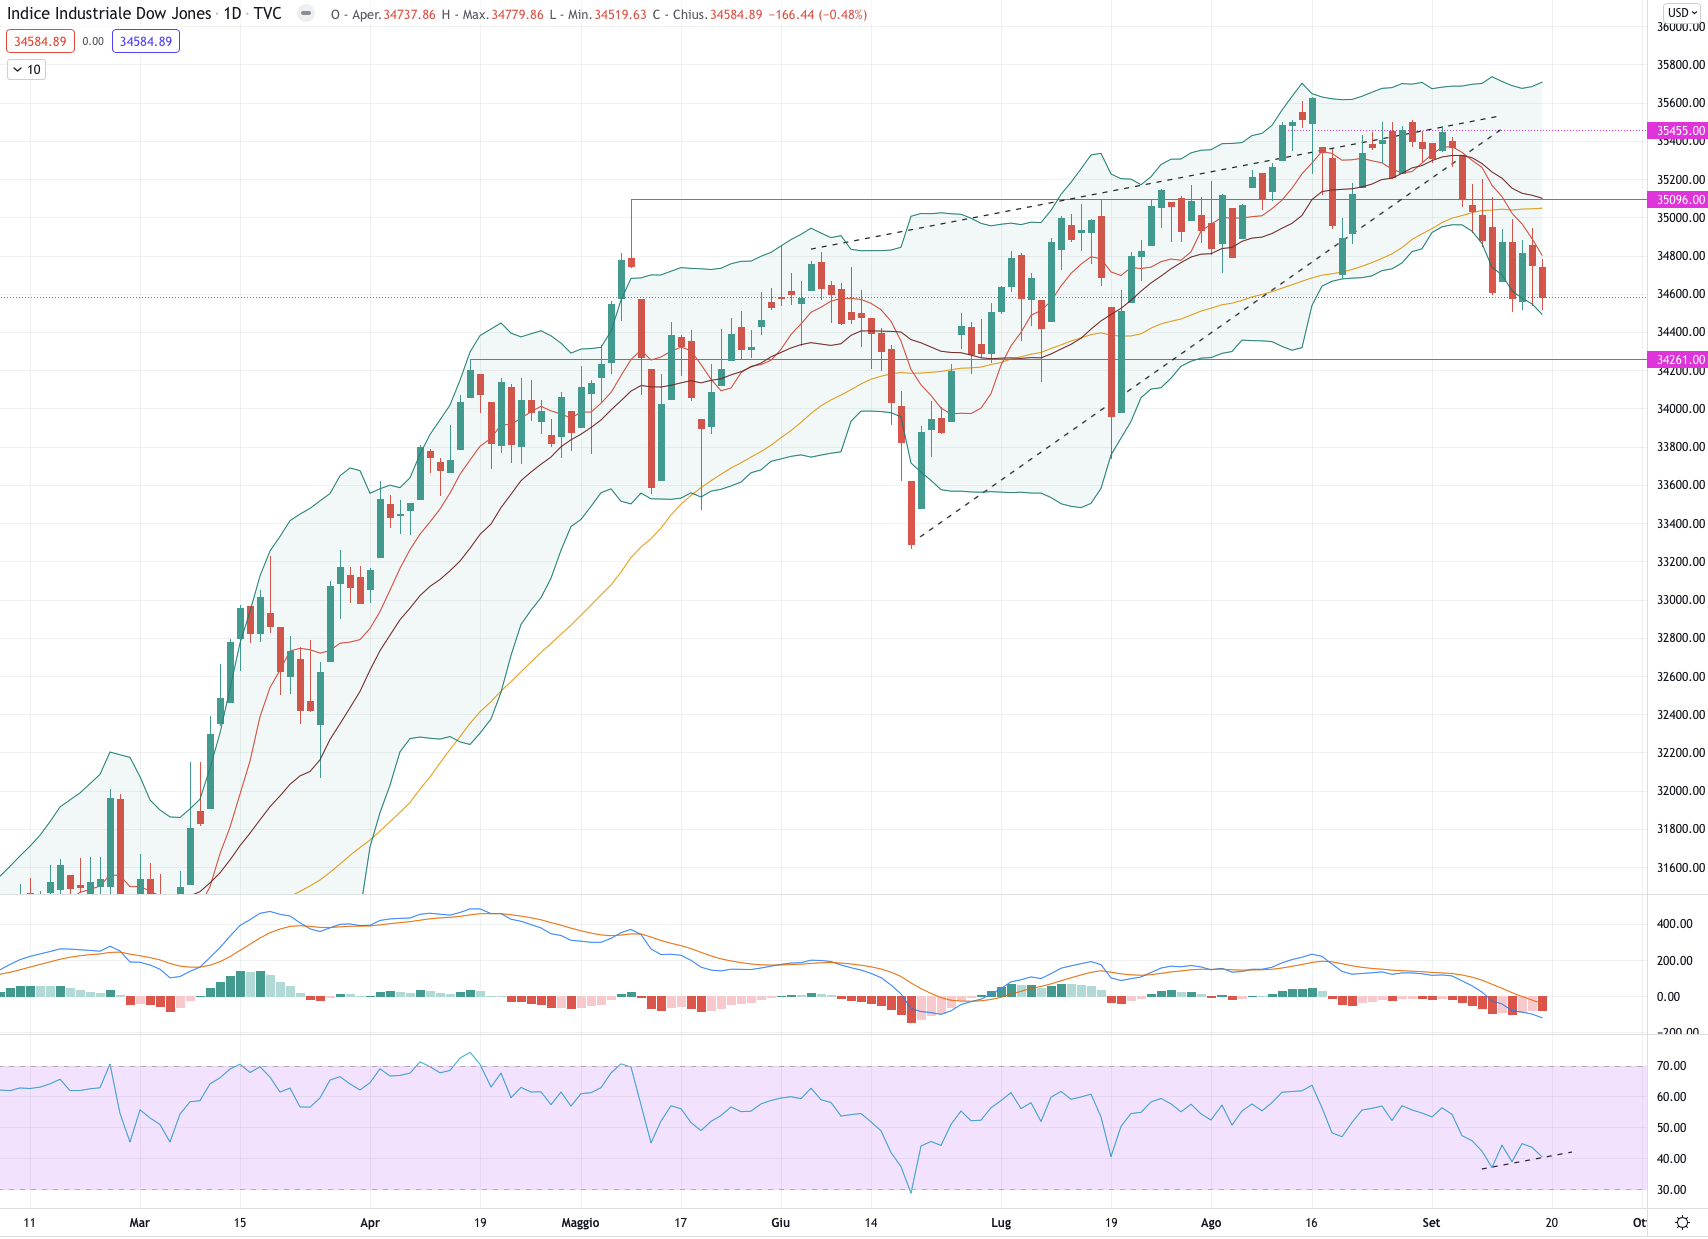
Dow Jones (#DJI)
DOW JONES had a week down by -0.66%.
For the coming week, we expect a recovery till 34,900.
Indicators
The DOW JONES after breaking the "rising wedge" is continuing to move downwards.
We believe that the intermediate support at 34,600 is supporting the index by positioning it now for a rise at 34,900, at least in the short term.
MACD is reducing its histograms below 0, suggesting a slight recovery.
RSI is diverging with the price: after the 10th September the oscillator began to move upwards, unlike the price which remained substantially unchanged.
In the event of a continuation to the downside till, we would be in an even better situation for long positions.
Support for 34.261.
Resistance 35,096.
Author

Francesco Bergamini
OTB Global Investments
Francesco, BSc Finance and Msc in Business Management, graduated with Merit, is a professional with experience in the financial services industry and a keen interest in the financial markets.


