Forex technical analysis and forecast: Majors, equities and commodities
EUR/USD, “Euro vs US Dollar”
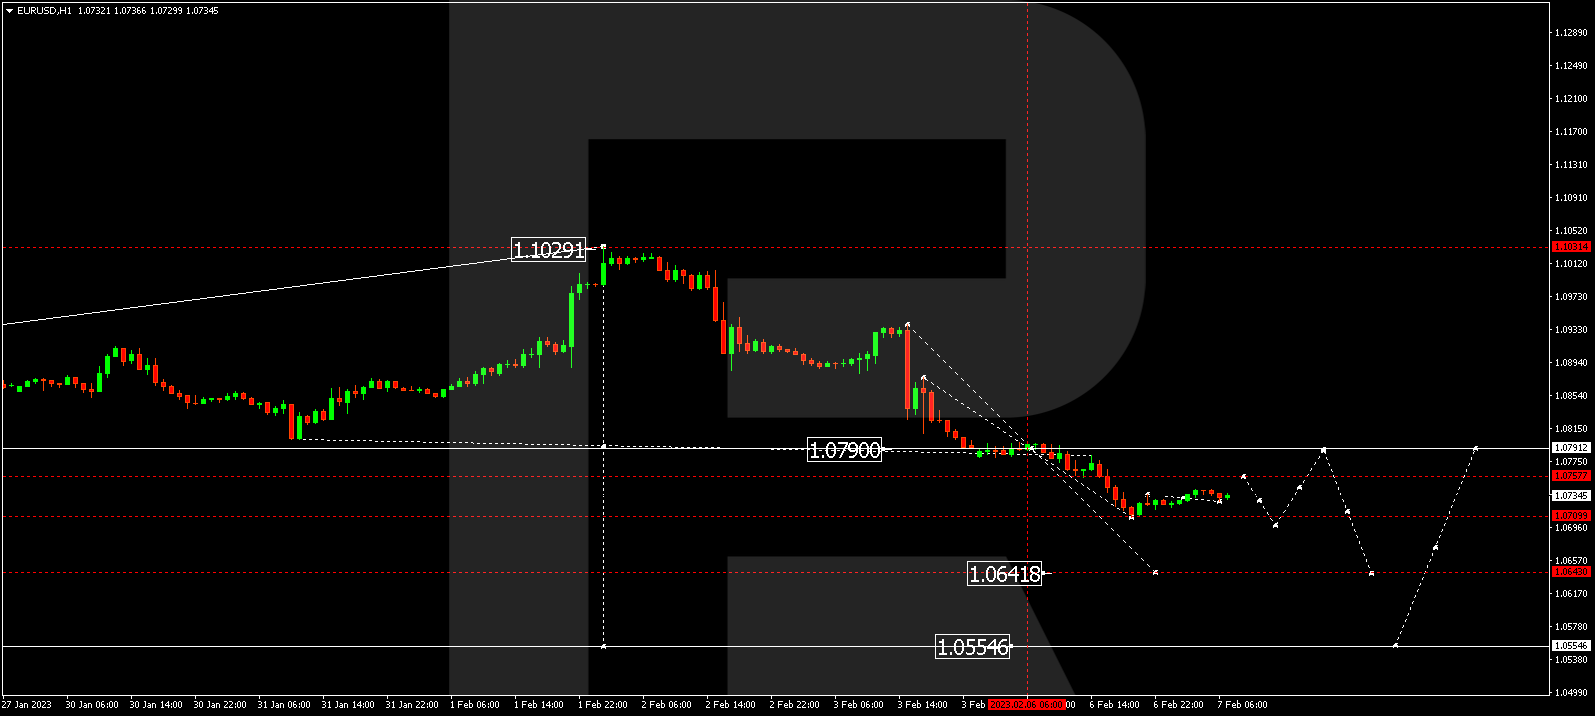
The currency pair has completed a wave of decline to 1.0709. Today a consolidation range may form above this level. A link of growth to 1.0757 and a decline to 1.0699 should follow. After this level is reached, a link of correction to 1.0791 is not excluded, followed by a decline to 1.0642. The goal is local.
GBP/USD, “Great Britain Pound vs US Dollar”
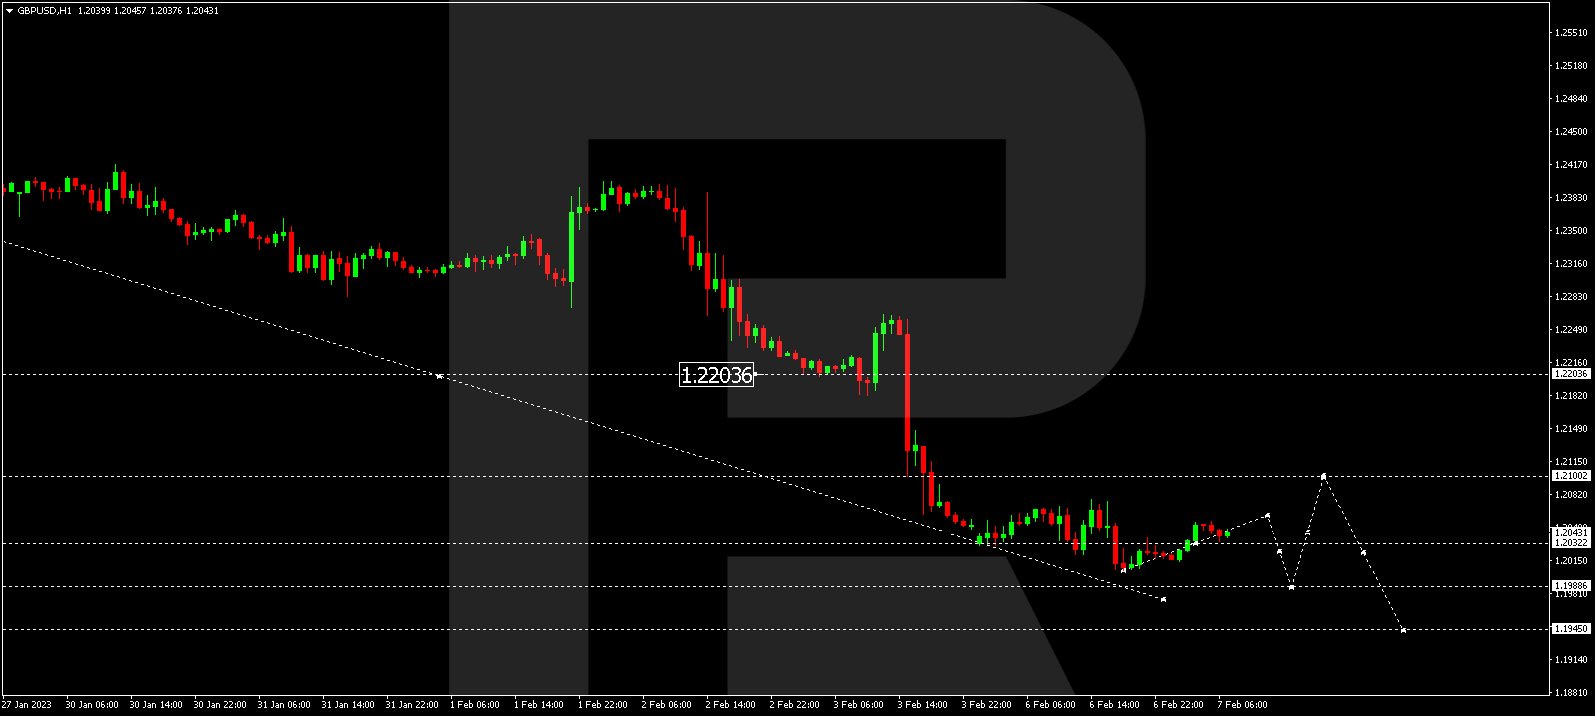
The currency pair has completed a wave of decline to 1.2005. At the moment, a consolidation range has formed above this level. Today the market may extend the range to 1.2060. Then a decline to 1.1988 is not excluded. And then a link of correction to 1.2100 may be expected. After the correction is over, a link of decline to 1.1945 should happen.
USD/JPY, “US Dollar vs Japanese Yen”
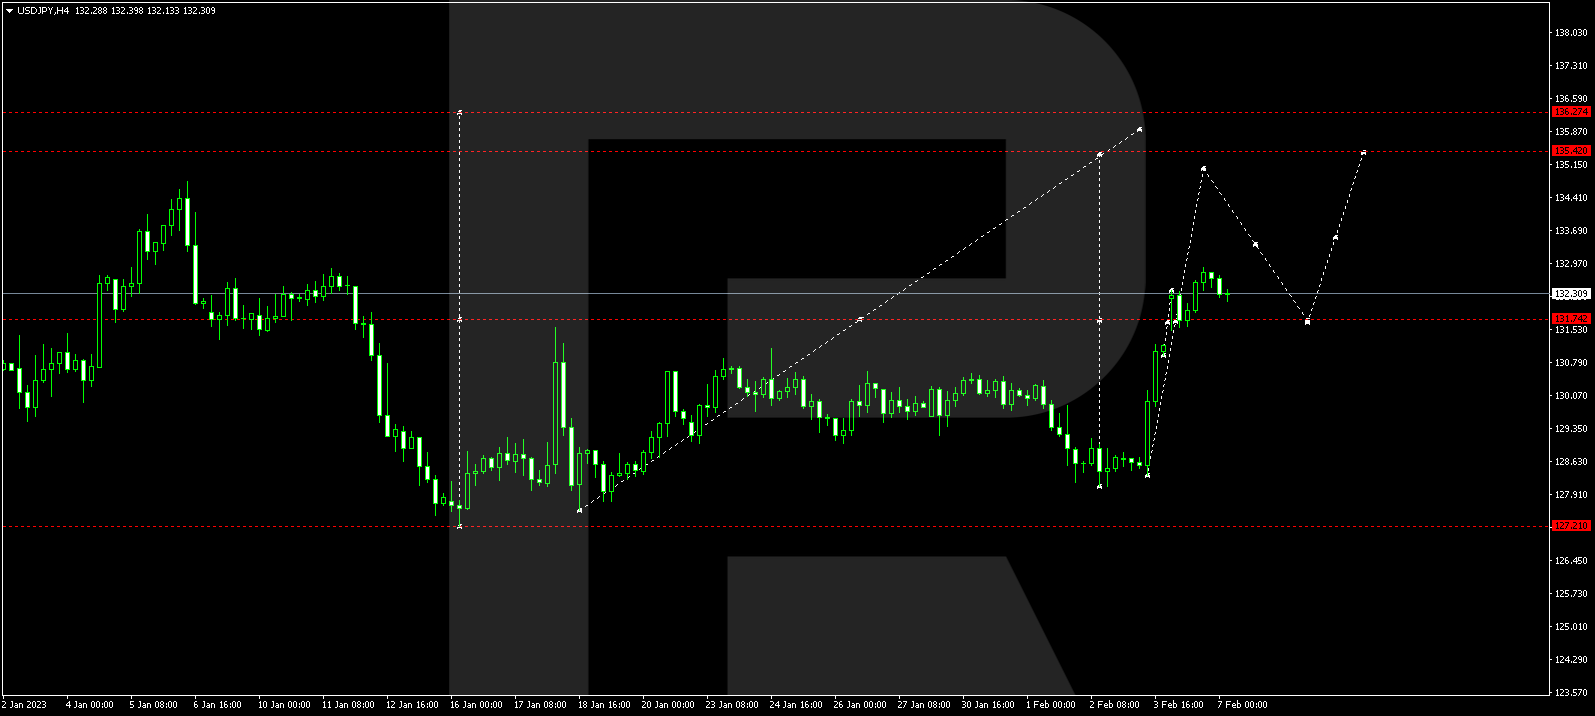
The currency pair has completed a wave of growth to 132.89. Today a link of decline to 131.91 should follow. Then a link of growth to 134.60 might be expected. The goal is local.
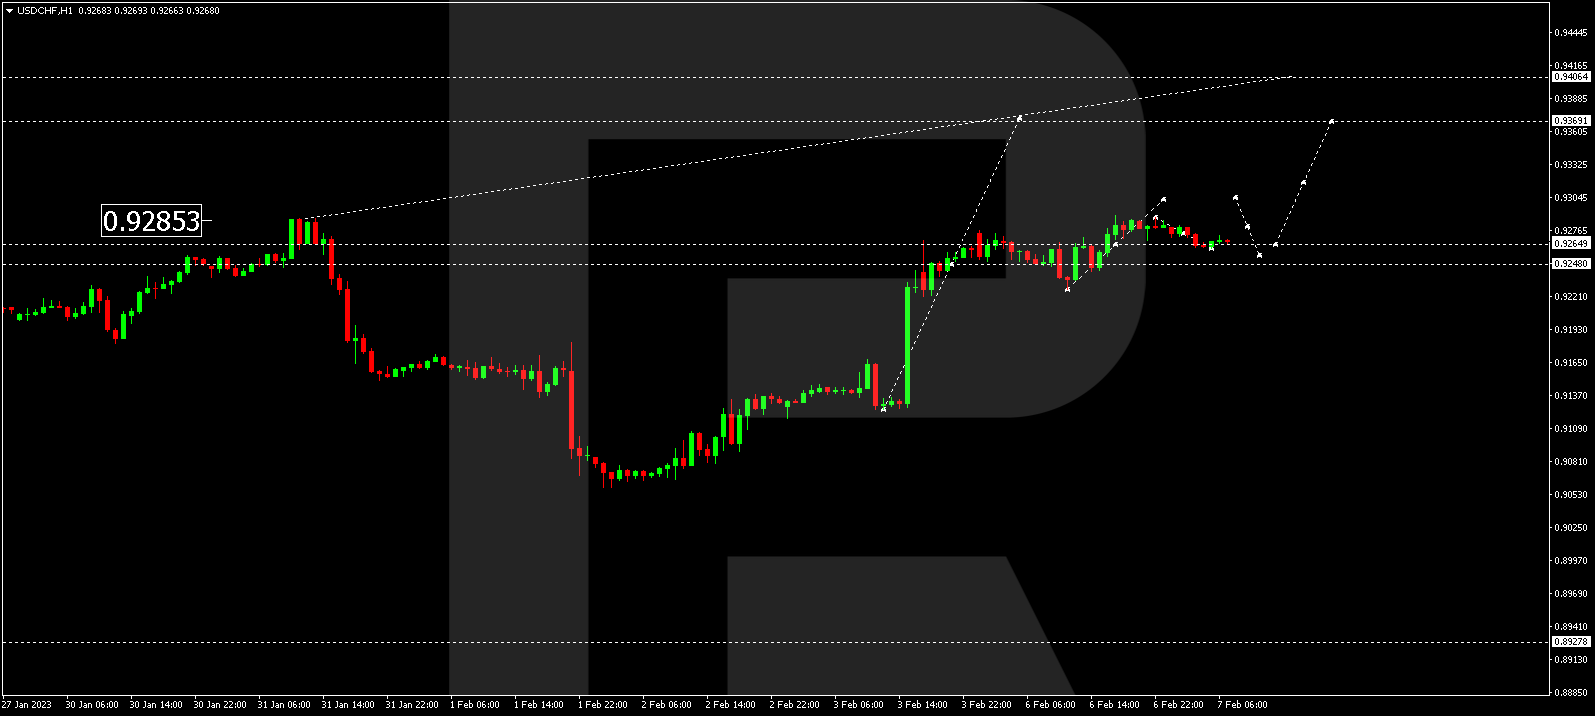
USD/CHF, “US Dollar vs Swiss Franc”
The currency pair has completed a wave of growth to 0.9289. Today the market is forming a link of decline to 0.9257. Then growth to 0.9300 should follow. Next, a link of correction to 0.9240 is not excluded. After the correction is over, growth should continue to 0.9370, from where the wave might extend to 0.9400.
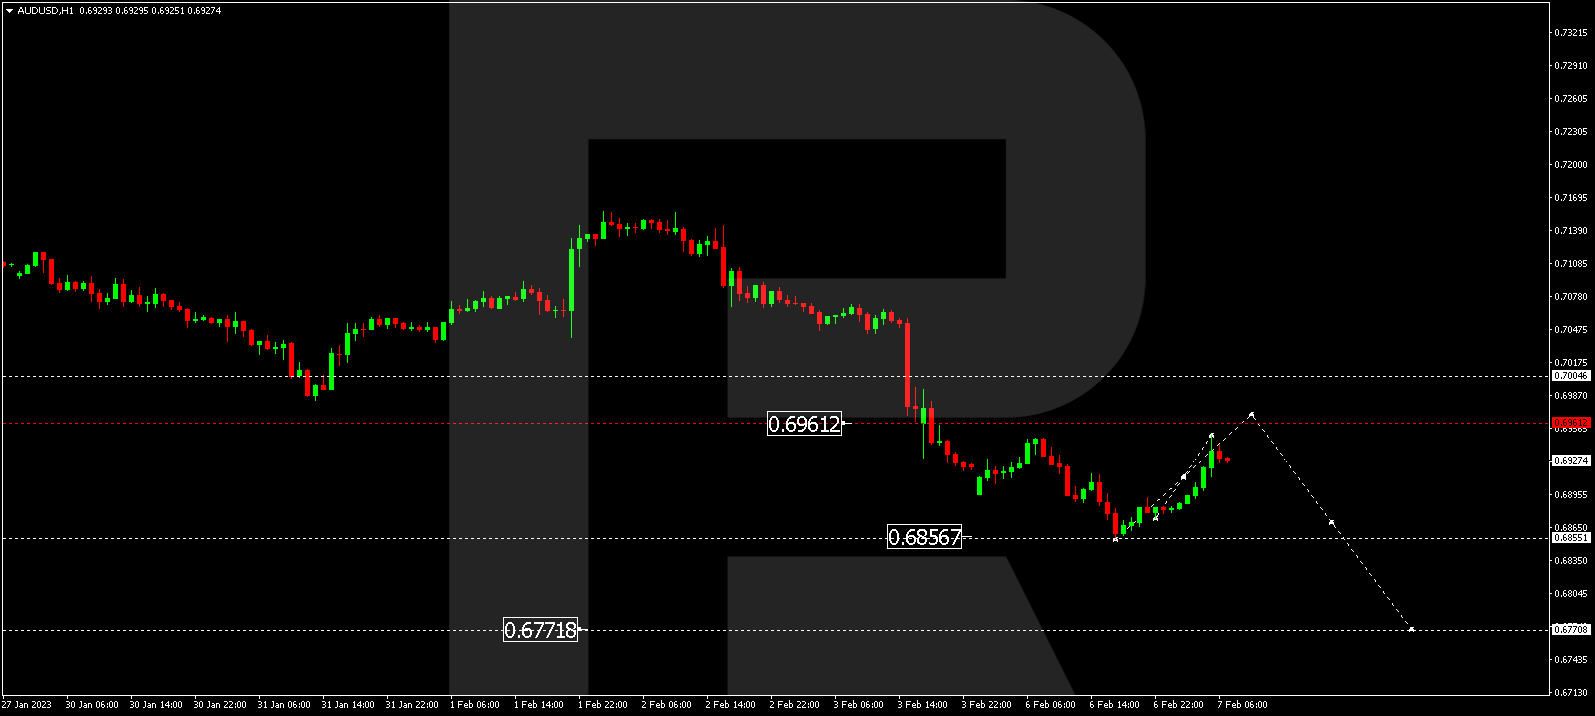
AUD/USD, “Australian Dollar vs US Dollar”
The currency pair has completed a structure of decline to 0.6855. Today a correction to 0.6966 should follow. Then a decline to 0.6860 might happen. And with a breakaway of this level, a pathway down to 0.6777 should follow.
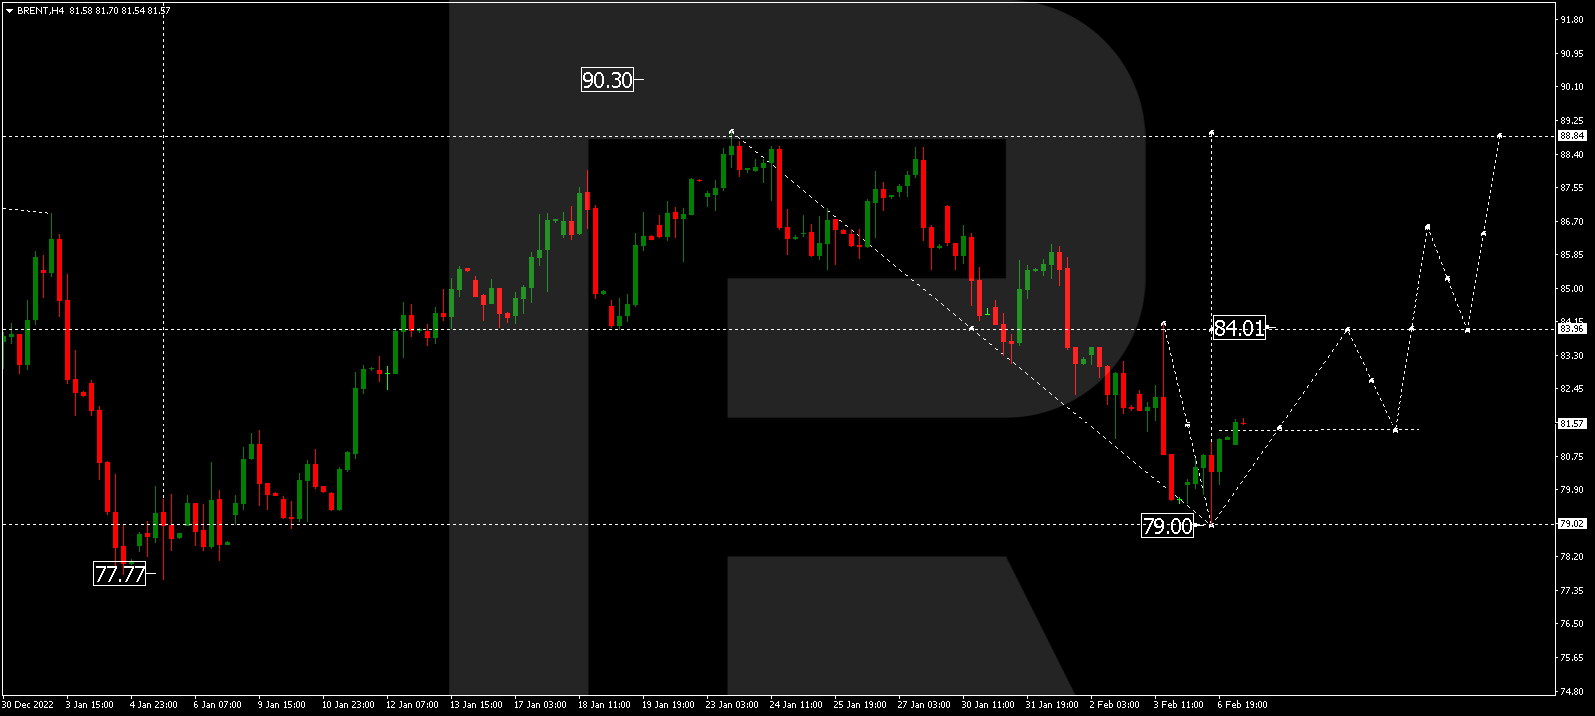
Brent
Brent has completed a wave of decline to 79.00. Today a wave of growth to 84.00 may follow. Then we should expect a correction to 81.40 and growth to 88.88. The goal is first.
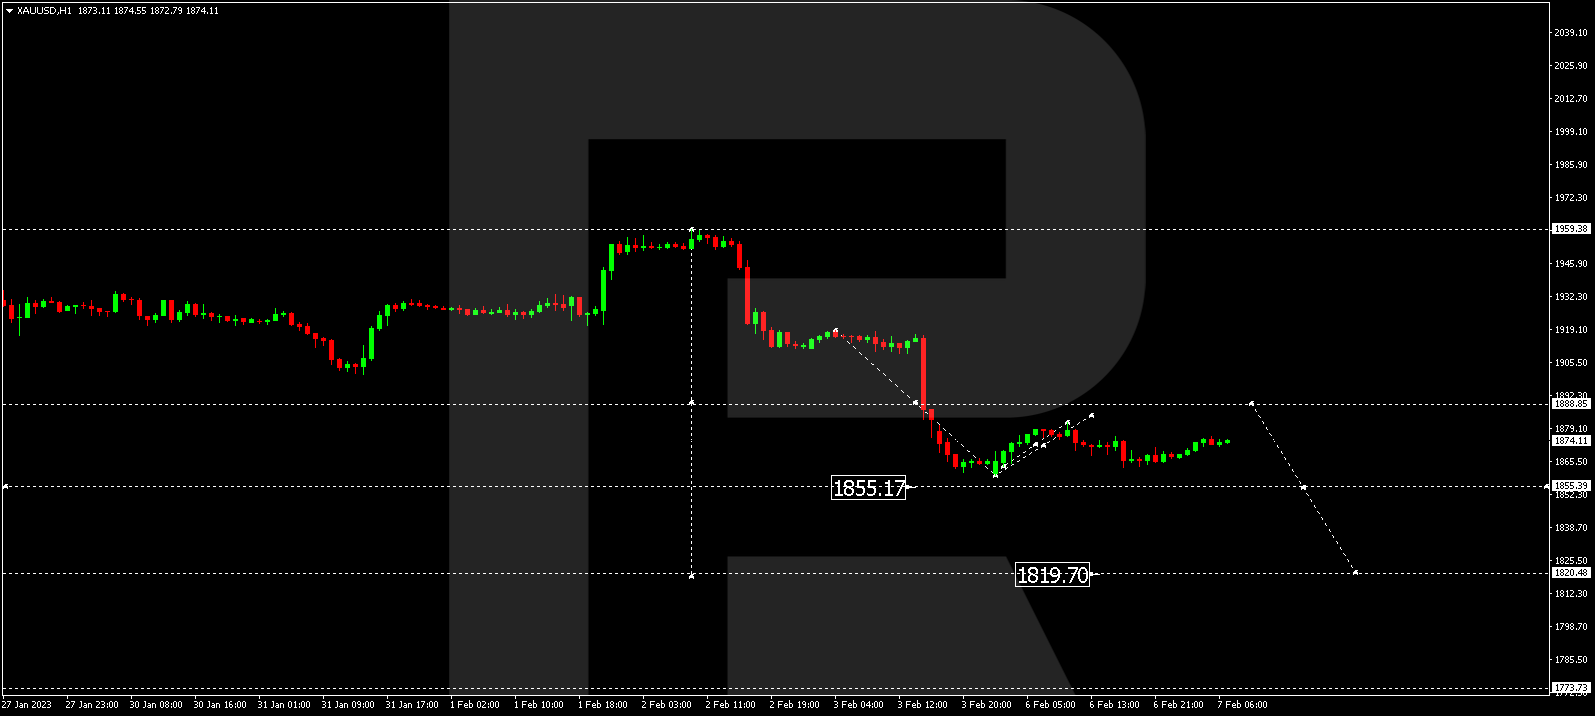
XAU/USD, “Gold vs US Dollar”
Gold has completed a structure of a declining wave to 1859.77. Today a link of growth to 1882.82 should follow. Then we expect a decline to 1855.55 and a correction to 1888.88. After the correction will be over, the wave of decline should continue to 1820.00.
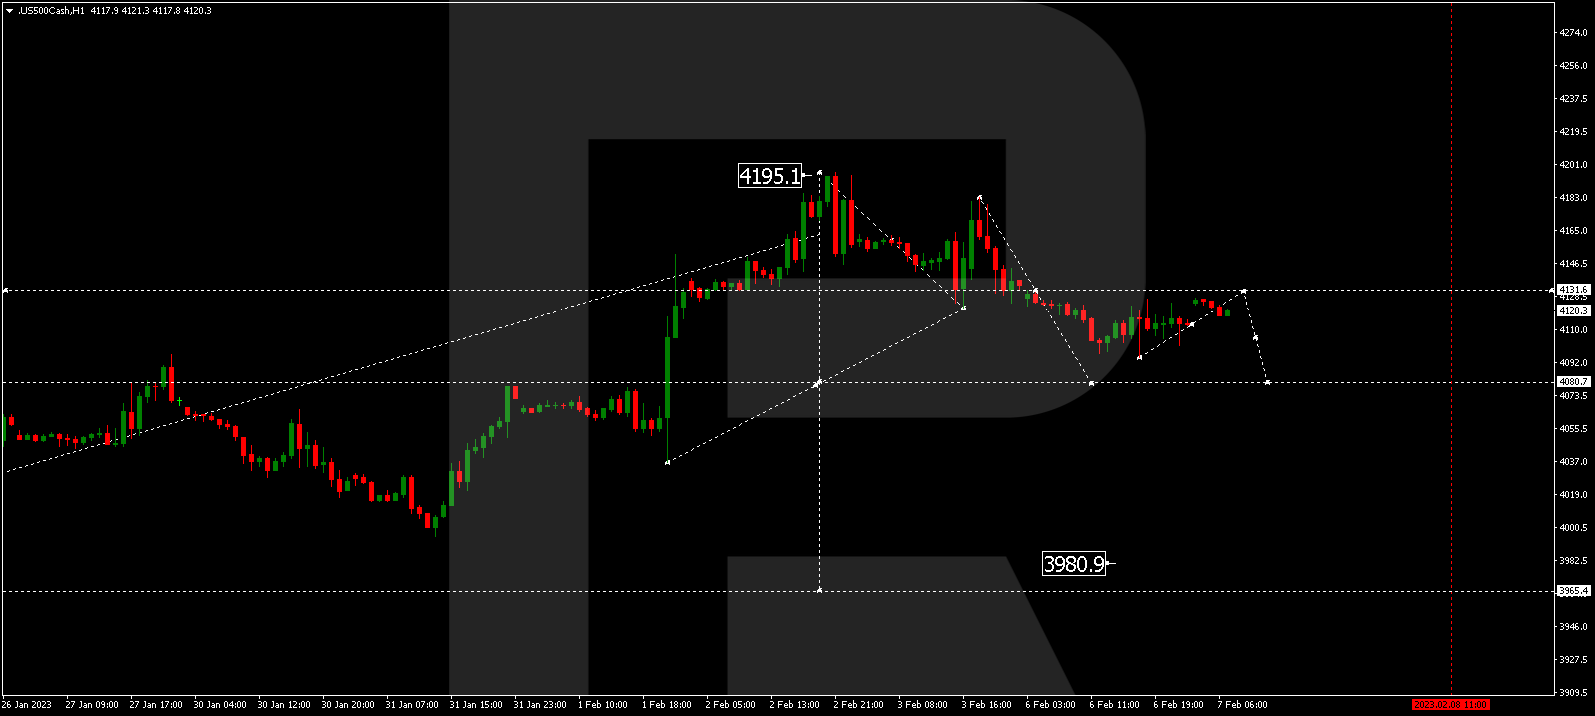
S&P 500
The stock index has completed an impulse of decline to 4095.0. Today a link of correction to 4131.0 is expected. After the correction will be over, a decline to 4080.0 might follow. And with a breakaway of this level, a pathway down to 3980.0 should open. The goal is local.
Author

RoboForex Team
RoboForex
RoboForex Team is a group of professional financial experts with high experience on financial market, whose main purpose is to provide traders with quality and up-to-date market information.


