Forex mildly risk positive but with little conviction

Market Overview
Forex traders seem to be opening the week on a fairly uncertain footing. Although there is the mild positive bias, a lack of any real direction across forex suggests little conviction. The US dollar is looking to shore up support after suffering in recent sessions as weak economic data continues to hold down longer dated Treasury yields as FOMC member comments question the immediacy of subsequent rate hikes. The euro is yet to react to news of two further Italian regional banks requiring a bailout, however the concern will be growing in the ECB. However it seems that the equity markets are taking the positive out of the news and are doing well today.

Wall Street closed mixed on Friday with the S&P 500 +0.2% at 2438, whilst Asian markets were mildly positive overnight (Nikkei +0.2%) whilst European indices are mixed to positive today. In forex there is a mixed outlook across the majors, however the yen is a mild underperformer, with sterling looking positive in early moves. In commodities, gold is slightly weaker by around $3 whilst oil is higher by a percent.
Traders will be eying the German Ifo Business Climate at 0900BST. The Ifo which is forecast to be 114.40 (which has little changed from 114.6 last month) been trending higher for several months now and last month hit the highest level since 2000, and have beaten expectations for the past four months. The Ifo has a positive correlation with German growth. The key data in the afternoon is the US Durable Goods Orders with core data forecast to be +0.5% (-0.4% last month) and has been tracking lower in recent months and has not beaten expectations this year.
Chart of the Day – Silver
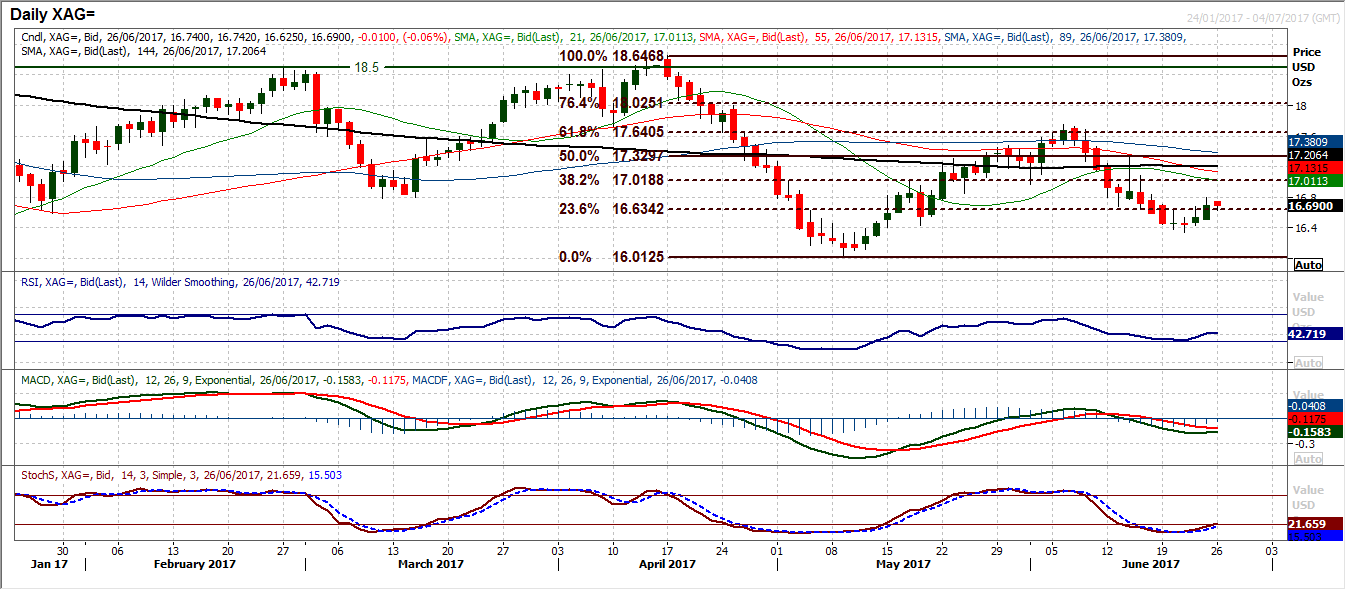
Has silver started to recover again? The market has been in decline over the past three weeks, but the last few sessions there seems to have been a change in sentiment. The candles have been increasingly less bearish and now two successive bull candles have been seen. The move has left a low at $16.33 and also closing at a six session high. The move is also a close back above the 23.6% Fibonacci retracement at $16.63 which has previously acted as resistance and improves the outlook. This now opens the 38.2% Fib at $17.02. The RSI has turned higher and is back above 40, whilst the Stochastics have started to tick higher. As yet there have not been any confirmed buy signals but the Stochastics crossing back above 20 would further improve the outlook. The 23.6% Fib at $16.63 is initially now supportive today, whilst a sequence of higher daily lows now means that there is support at $16.51, with $16.33 adding importance with every day that remains intact.
EUR/USD
The euro remains firmly stuck in its band of just under 200 pips above the longer term pivot at $1.1100 and the June high of $1.1295. The latest rebound from the support looked to be gathering pace with Friday’s bullish candle that added 40 pips and it will now be interesting to see if the buyers can run with this move again this week. The momentum indicators are settling now on a medium term basis with the RSI back above 50, whilst the MACD and Stochastics lines are bottoming. This all points to the ongoing range trade. There is little real direction of note yet today but the bulls will be eying initial resistance at $1.1213 which was last week’s high. The hourly chart shows $1.1200 is an initial barrier, whilst the old pivot at $1.1160 is initially supportive. The hourly chart shows a mild positive momentum configuration as near term corrections are now being bought into.

GBP/USD
Cable is recovering once more back towards the key overhead supply and resistance around $1.2775. This remains the key long term pivot and latterly breakdown level that will be watched as the rally has taken hold in the past few days. Momentum indicators are configured to suggest that rallies are now a chance to sell, with the RSI pulling back towards 50, but repeatedly in recent weeks the market has failed to break above $1.2775 on a closing basis and this latest rally that is now 150 pips is once more likely to struggle. This would all change on a move above the intraday highs at $1.2817 (preferably with a close above). The hourly chart reflects the recent improvement but there could also be early signs of a negative divergence on the hourly RSI which would suggest slowing momentum in the recovery. Initial support is $1.2705 and a breach would re-open the downside.

USD/JPY
Over the course of the past few days there has been very little movement with a string of very mildly negative candles that have formed the slightest of bear drifts. However this is by no means an indication of decisive direction, with the lack of conviction being clear. This is reflected in the momentum indicators which have the RSI flat just above 50 and MACD lines plateauing around neutral. Once more today the market is struggling for direction in the early moves. The concern for the bulls is that this is all occurring around the 38.2% Fibonacci retracement at 111.55 which is also close to the medium term pivot at 111.60 which is still a barrier on a closing basis. Initial resistance is 111.80, whilst the hourly chart shows 110.92 is supportive. In the meantime though, the market looks for direction.

Gold
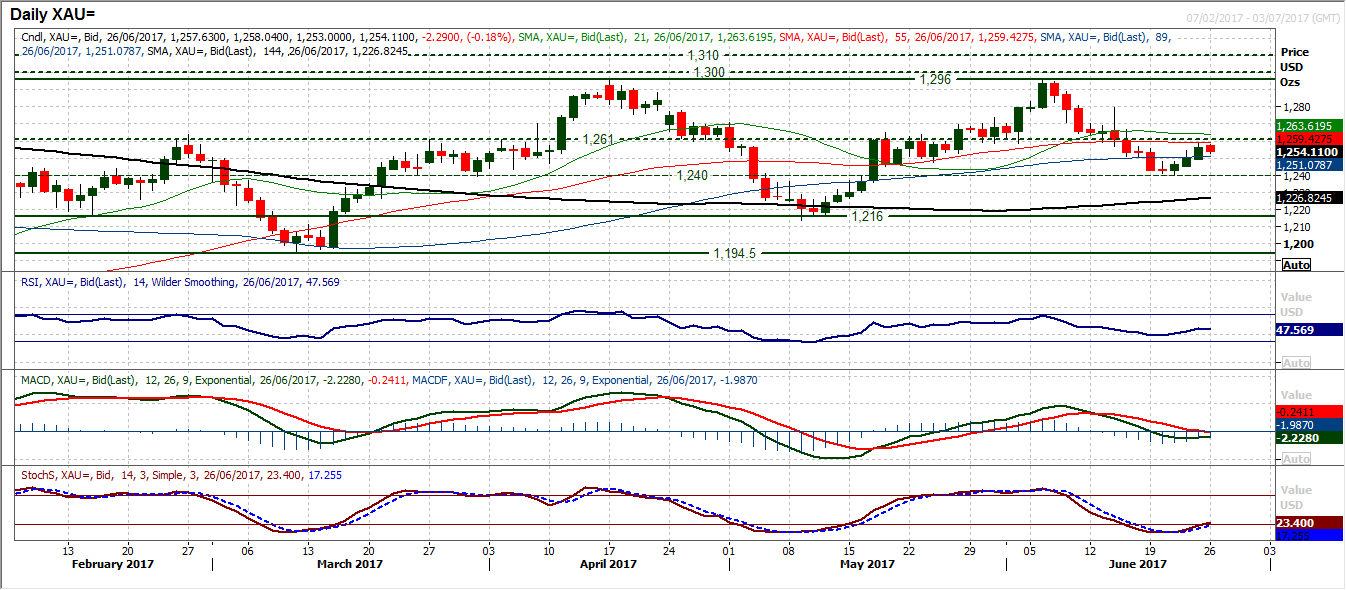
Gold broke decisively below the medium term pivot at $1261 a couple of weeks ago to change the outlook. The move increased pressure to the downside and means that the bulls are no longer the controlling force on a medium term basis. The market is now a choppy range trade one more. As the rally in the past three days has taken off from $1241, the market has begun to build again, however the old pivot support at $1261 is now a basis of resistance. Momentum indicators are on the brink now of taking improvement to the next stage but the $1261 resistance needs to be overcome to back the recovery. An initial sighting today has been unsuccessful and the positive hourly chart momentum configuration needs to be sustained. The low at $1247.70 needs to hold to maintain the momentum in the recovery. The importance of the support around $1240, an old pivot, is increasing.
WTI Oil
Is this a recovery in the early stages? The downtrend channel of the past four weeks is still intact with rallies continuing to be sold into. Within this, the bears are still ready to pout pressure on the key November low at $42.20 and will be looking for a daily close below the key support which would open the next key low of the August 2016 low at $39.25. However, it is interesting to see that the support of the November low is yet to be decisively breached and this comes with the RSI back above 30. This is a similar position to the selling pressure of early March and late April, both of which resulted in sharp recoveries. The MACD lines are also similarly configured. The Stochastics have been bearish now for over two weeks (again similar to late April). We must therefore be cautious from making further drastic downside targets as the downtrend channel is increasingly under pressure. Whilst the bearish outlook is firmly intact, the bulls will be waiting for an opportunity. There is a band of resistance $43.75/$44.40 to now watch. A close above would also be an upside break from the downtrend channel.

Dow Jones Industrial Average
The Dow has been slipping back for the past few sessions, however the bulls will be asking the question of whether this is another chance to buy or a deeper correction forming. For now it looks to be simply another buying opportunity. The corrective moves have tended to find support around or above the previous breakouts, and this means that the key support band is 21,169/21,225. The four day correction has pulled the momentum into a mild deterioration but the RSI is still above 60 and the MACD lines still positively configured. The candles of the past two sessions have been getting progressively less corrective, culminating in Friday’s close being above the open (despite a slight close down on the day). This means that today’s candle could be key. A positive close with a bullish candle formation could once more begin to ignite the buying pressure once more. It would need a close below 21,169 to open a deeper correction, with a five month uptrend support currently at 20,875.

Author

Richard Perry
Independent Analyst


