Forex analysis on EUR/USD, GBP/JPY and CAD/CHF

EUR/USD may move back to parity
EUR/USD managed to move rise by almost 1,000 pips after it has been falling for more than a year. In fact, this pullback was needed as the currency pair dropped by more than 20% in just twelve months. The eurodollar moved from $0.9534 to $1.047 in two months in the midst of a US dollar retreat.
Related article: Stock indices may crash again soon
Now the currency pair stopped at a trend line and resistance. It could be heading back to parity if it fails to break the trend line. Several failed divergences also point to a possible overheated upward move, drawing EUR/USD back down.
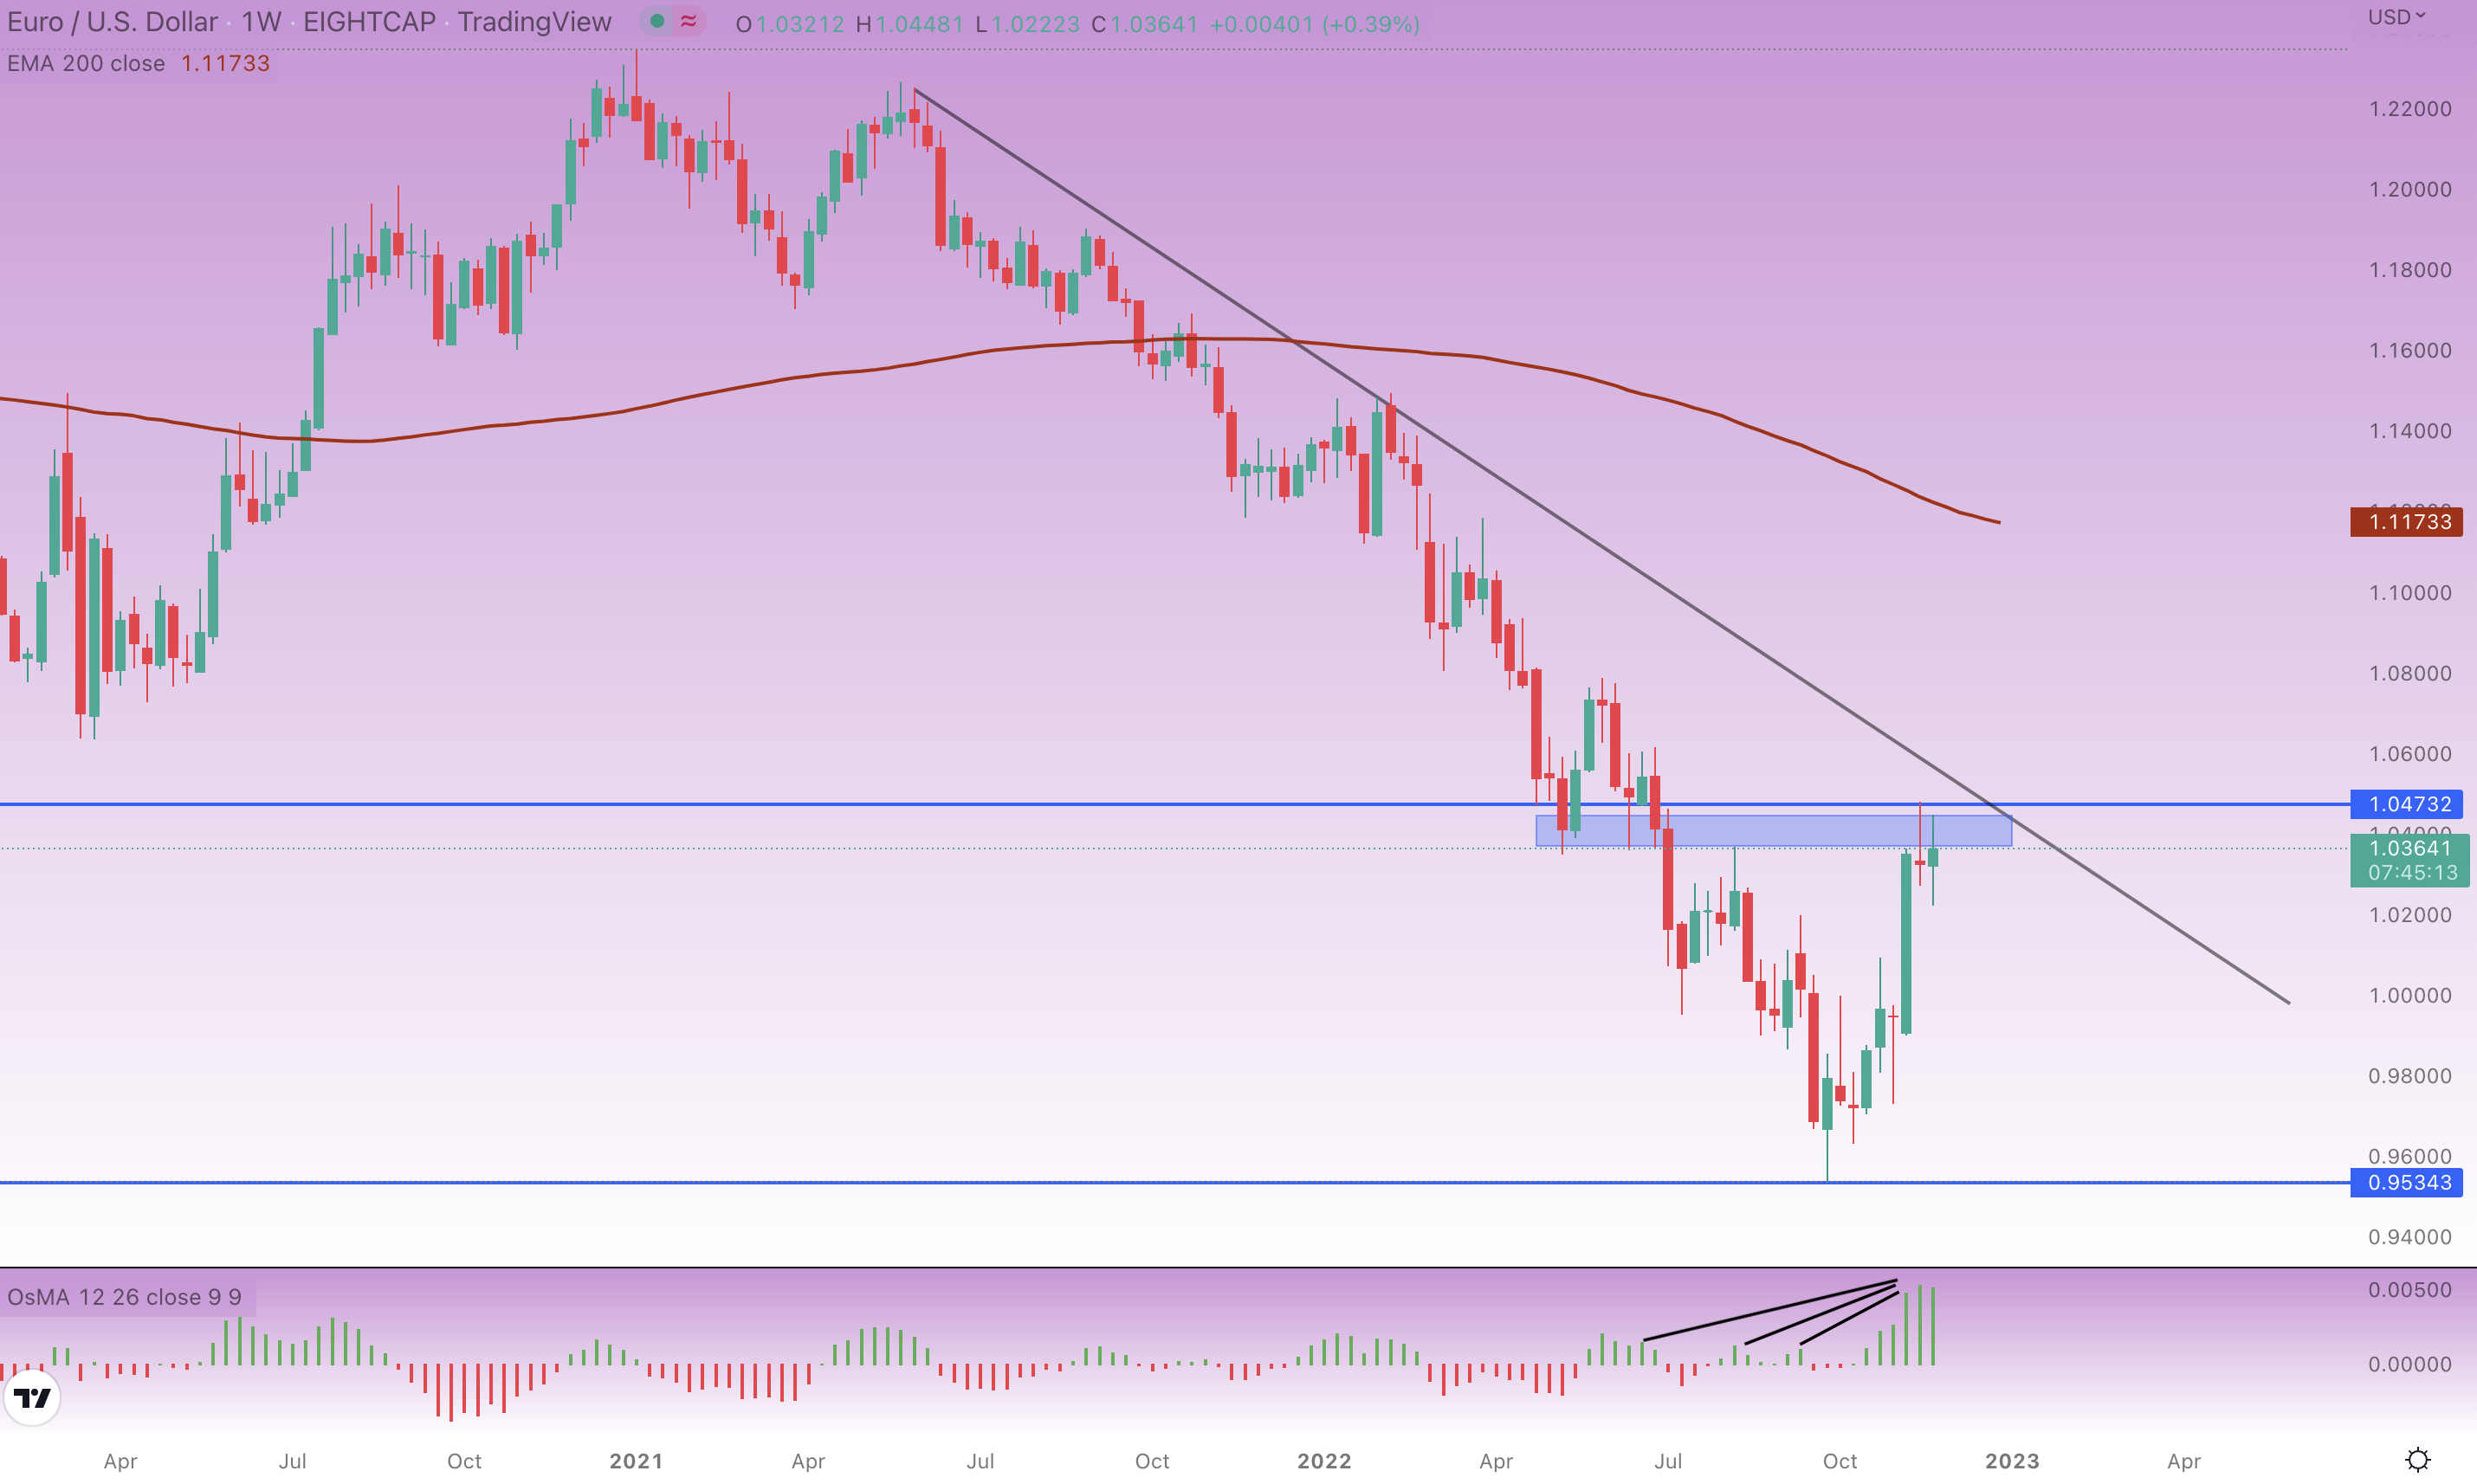
EUR/USD is forming a double top pattern, while bouncing from a 200-day moving average (EMA200). The eurodollar might be moving back to parity until the end of 2022, but traders need to stay cautious as there still wasn’t a full bounce from the trend line.
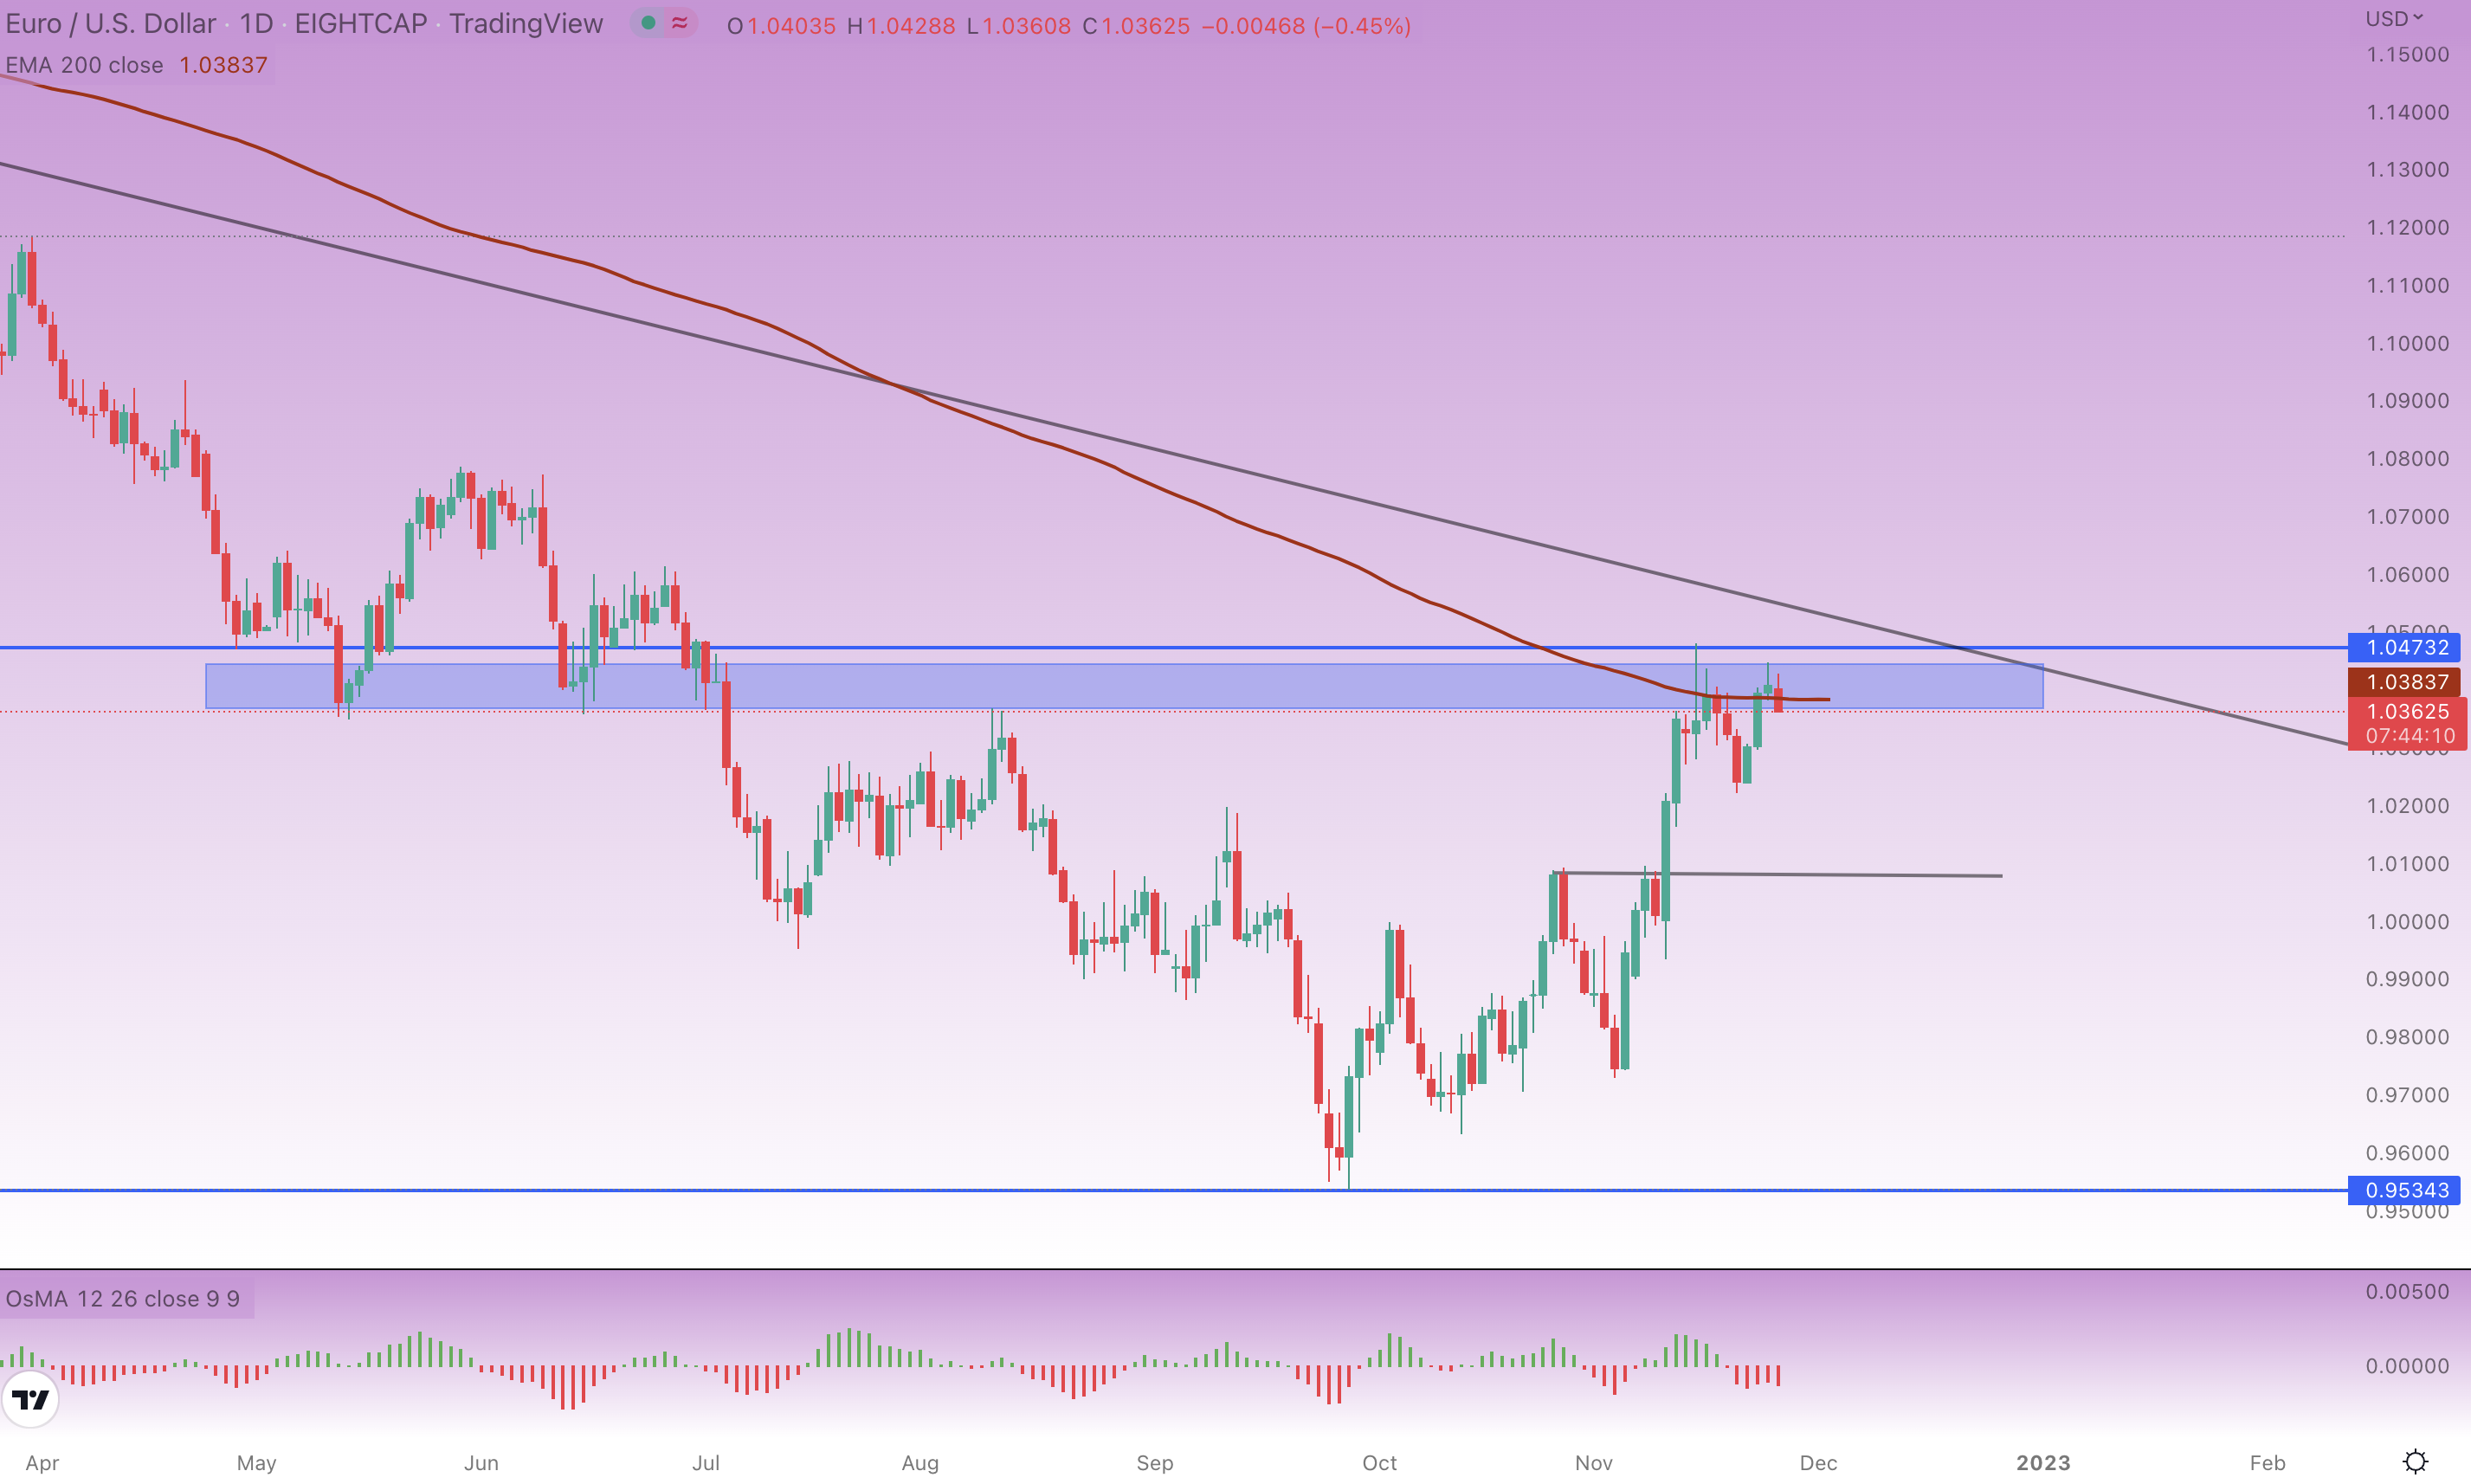
The technical analysis suggests EUR/USD will go down temporarily, but traders need to wait for a confirmation signal. It will probably form in the next few days after the weekend. However, if the currency pair manages to get above the trend line, uptrend is confirmed and it could rise to 1.1000.
CAD/CHF at important support level
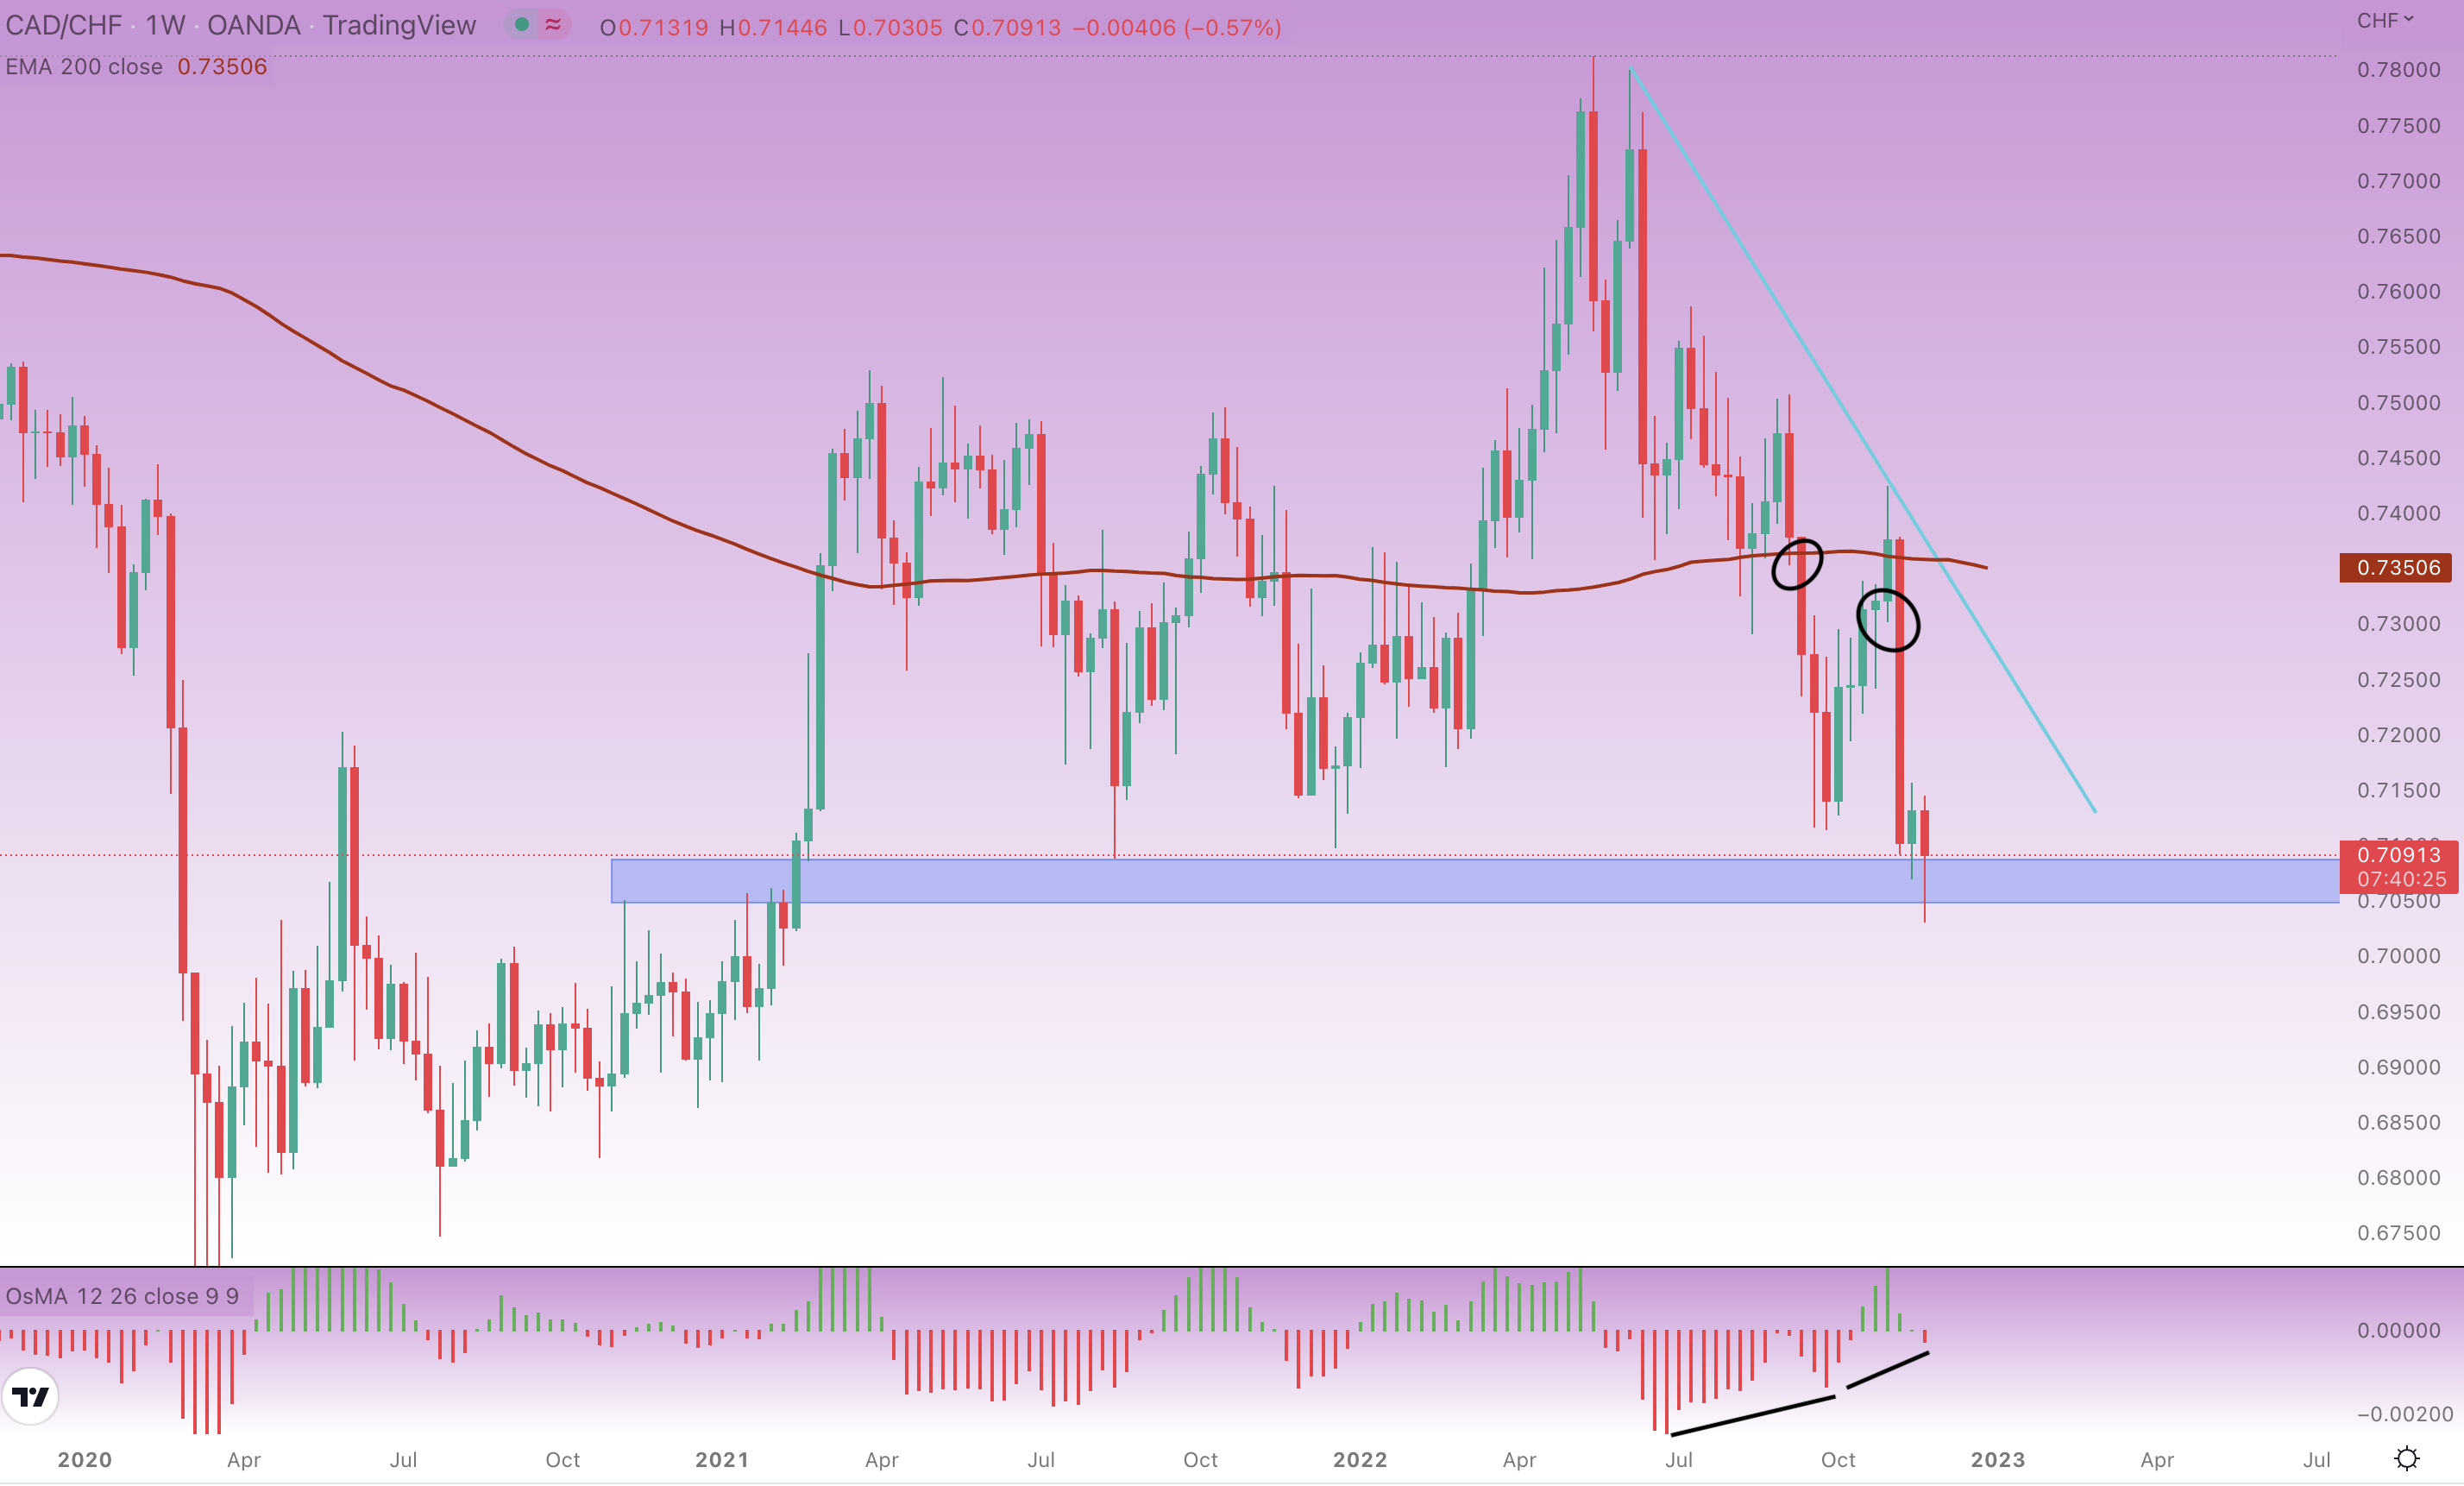
CAD/CHF fell close to an important support a few weeks back and then filled the gap marked in a circle. A bullish divergence helped the currency pair to move higher, and a similar signal is forming right now.
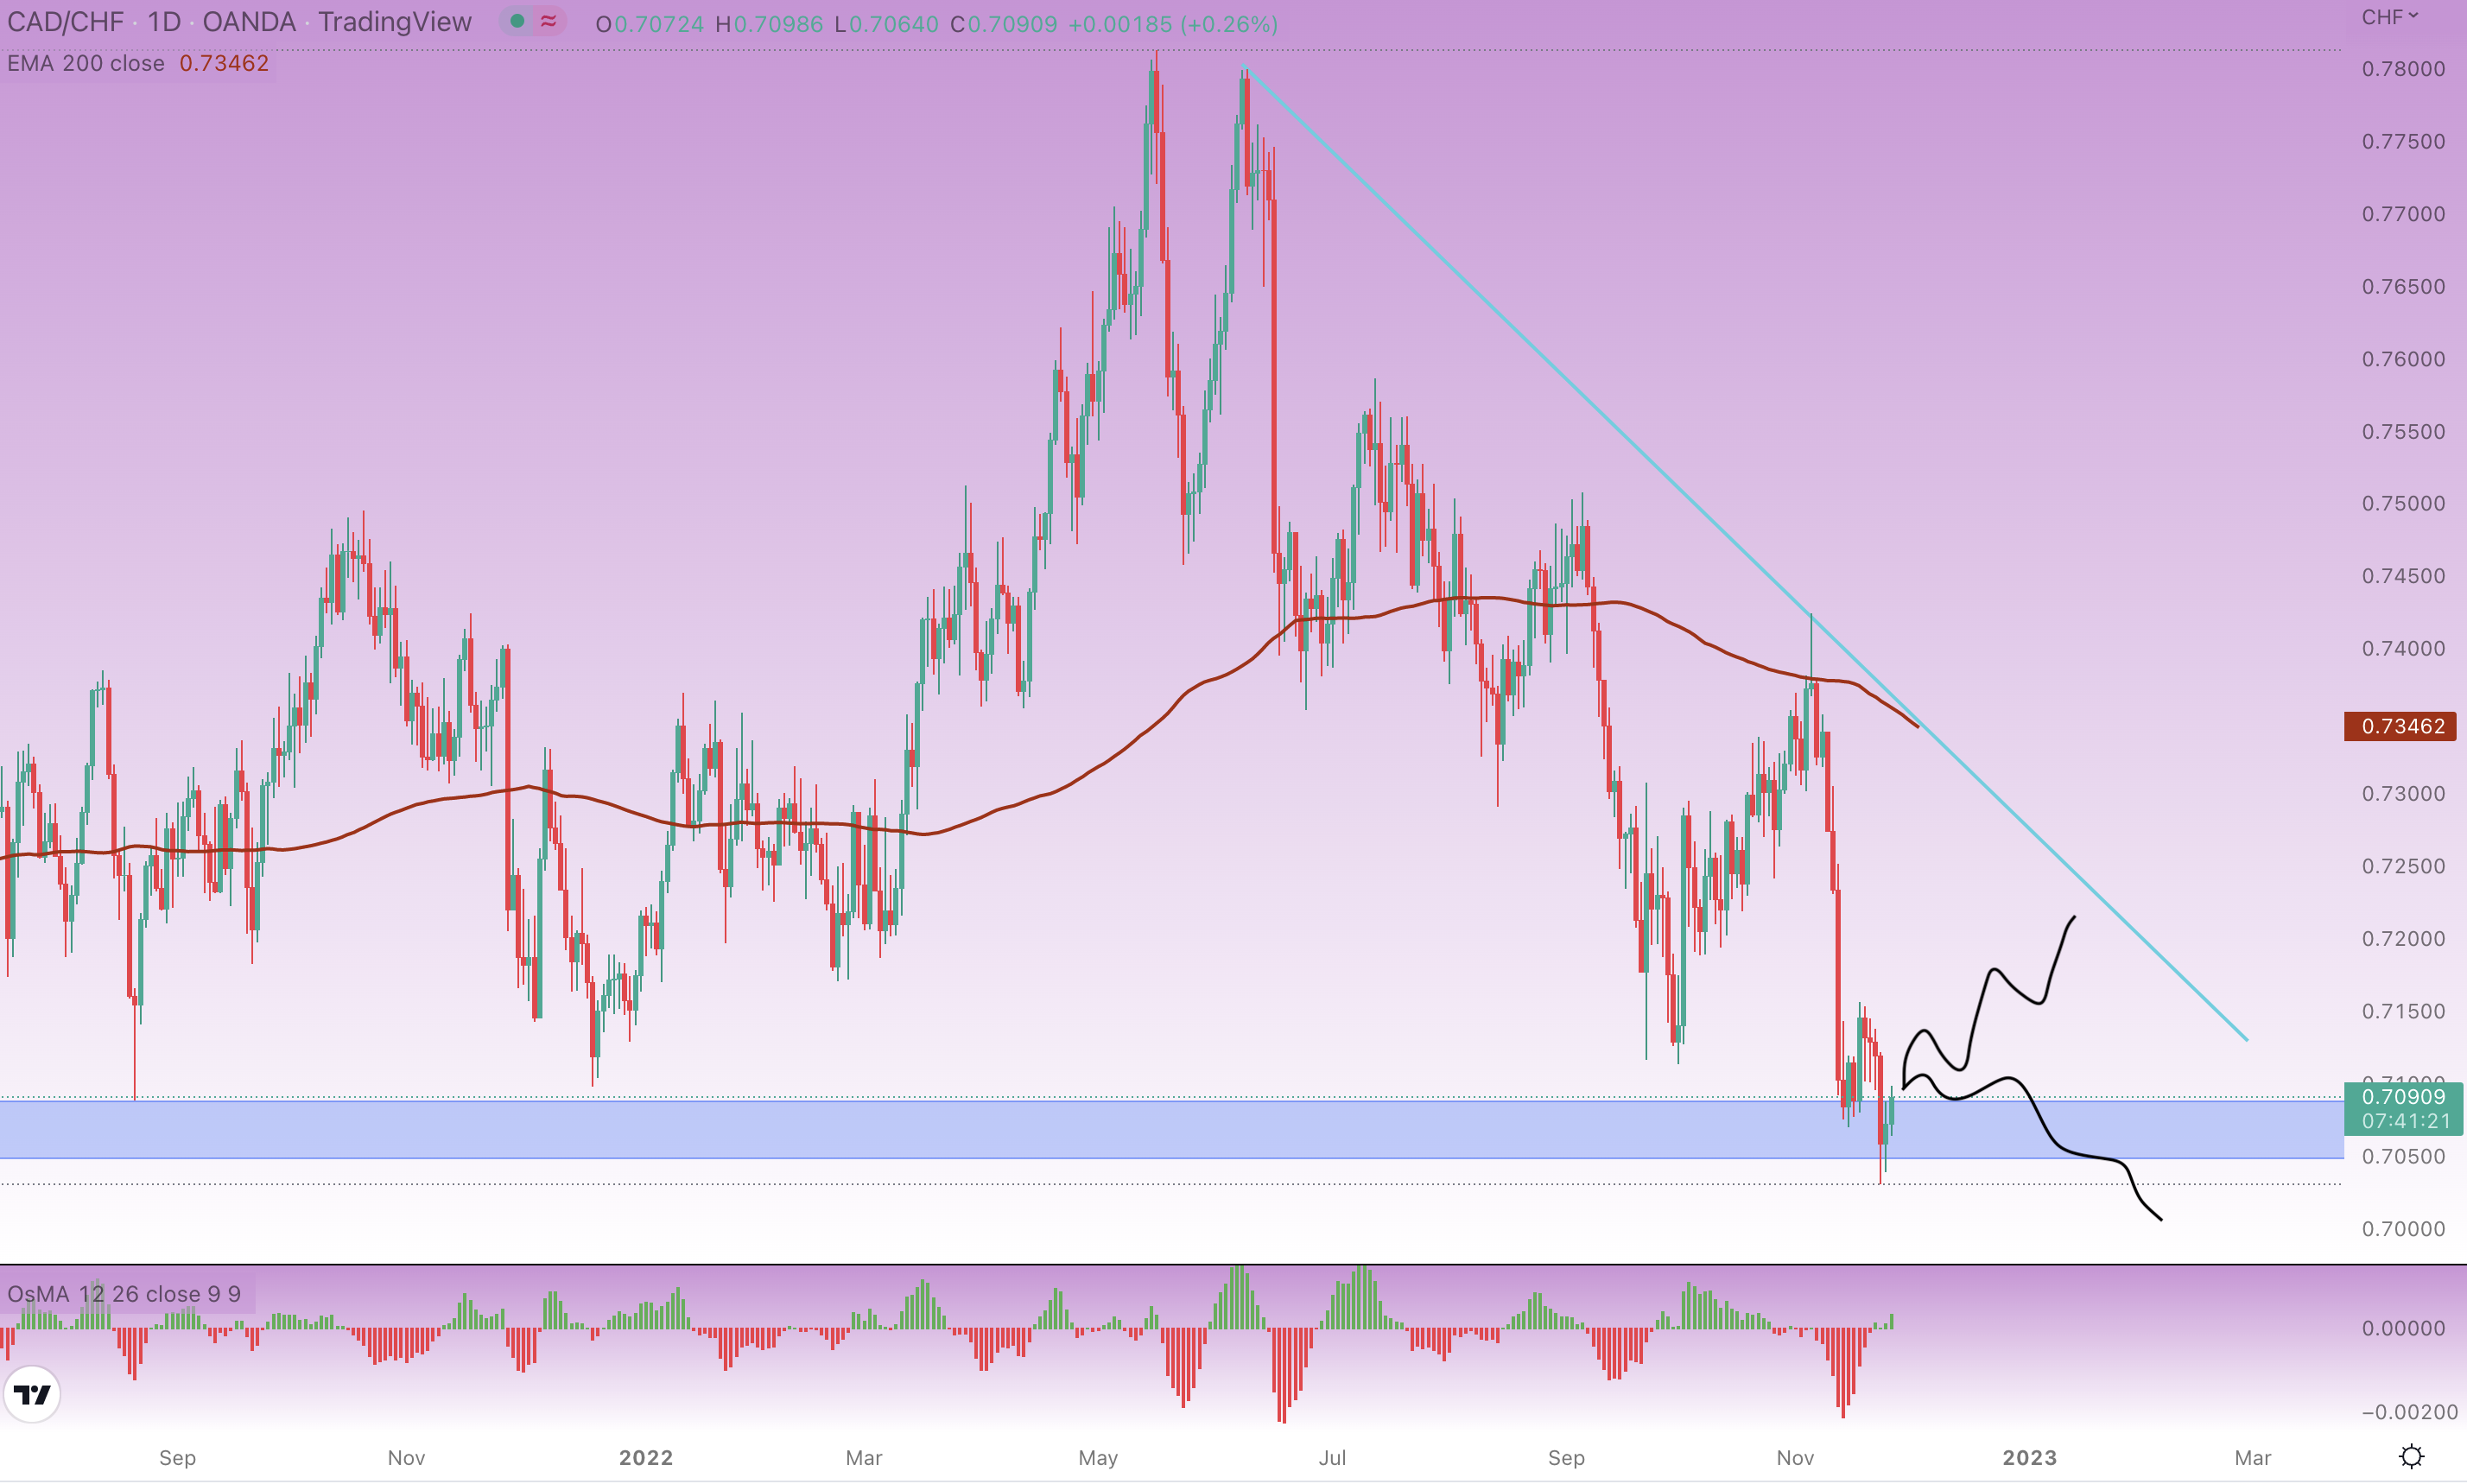
There is a new bullish divergence, which could send CAD/CHF up again. After it failed to fall below 0.7000, it will likely fill the gap in the circle like last time. This offers an opportunity for 150-200 pip move to the upside.
This was very probably a falsebreak, indicating this is a buying opportunity. However, a confirmation should be formed before entering the trade as the downtrend is still raging. In the next few days, an engulfing pattern or a pin bar on lower timeframes could confirm the move to the trend line. If no confirmation arrives, it could continue downward, making this breakout.
GBP/JPY at trend line
The pound has been one of the most volatile currencies in the last couple of weeks. GBP/JPY fell more than 1,000 pips and then jumped by 2,000 pips. After the currency pair found its peak at 172.00, it has been creating lower highs and lower lows since.
It seems that another price distribution is happening at 169.03, possibly sending GBP/JPY down again. There is a clear opportunity to short it, but we need to wait for a confirmation signal as with CAD/CHF.
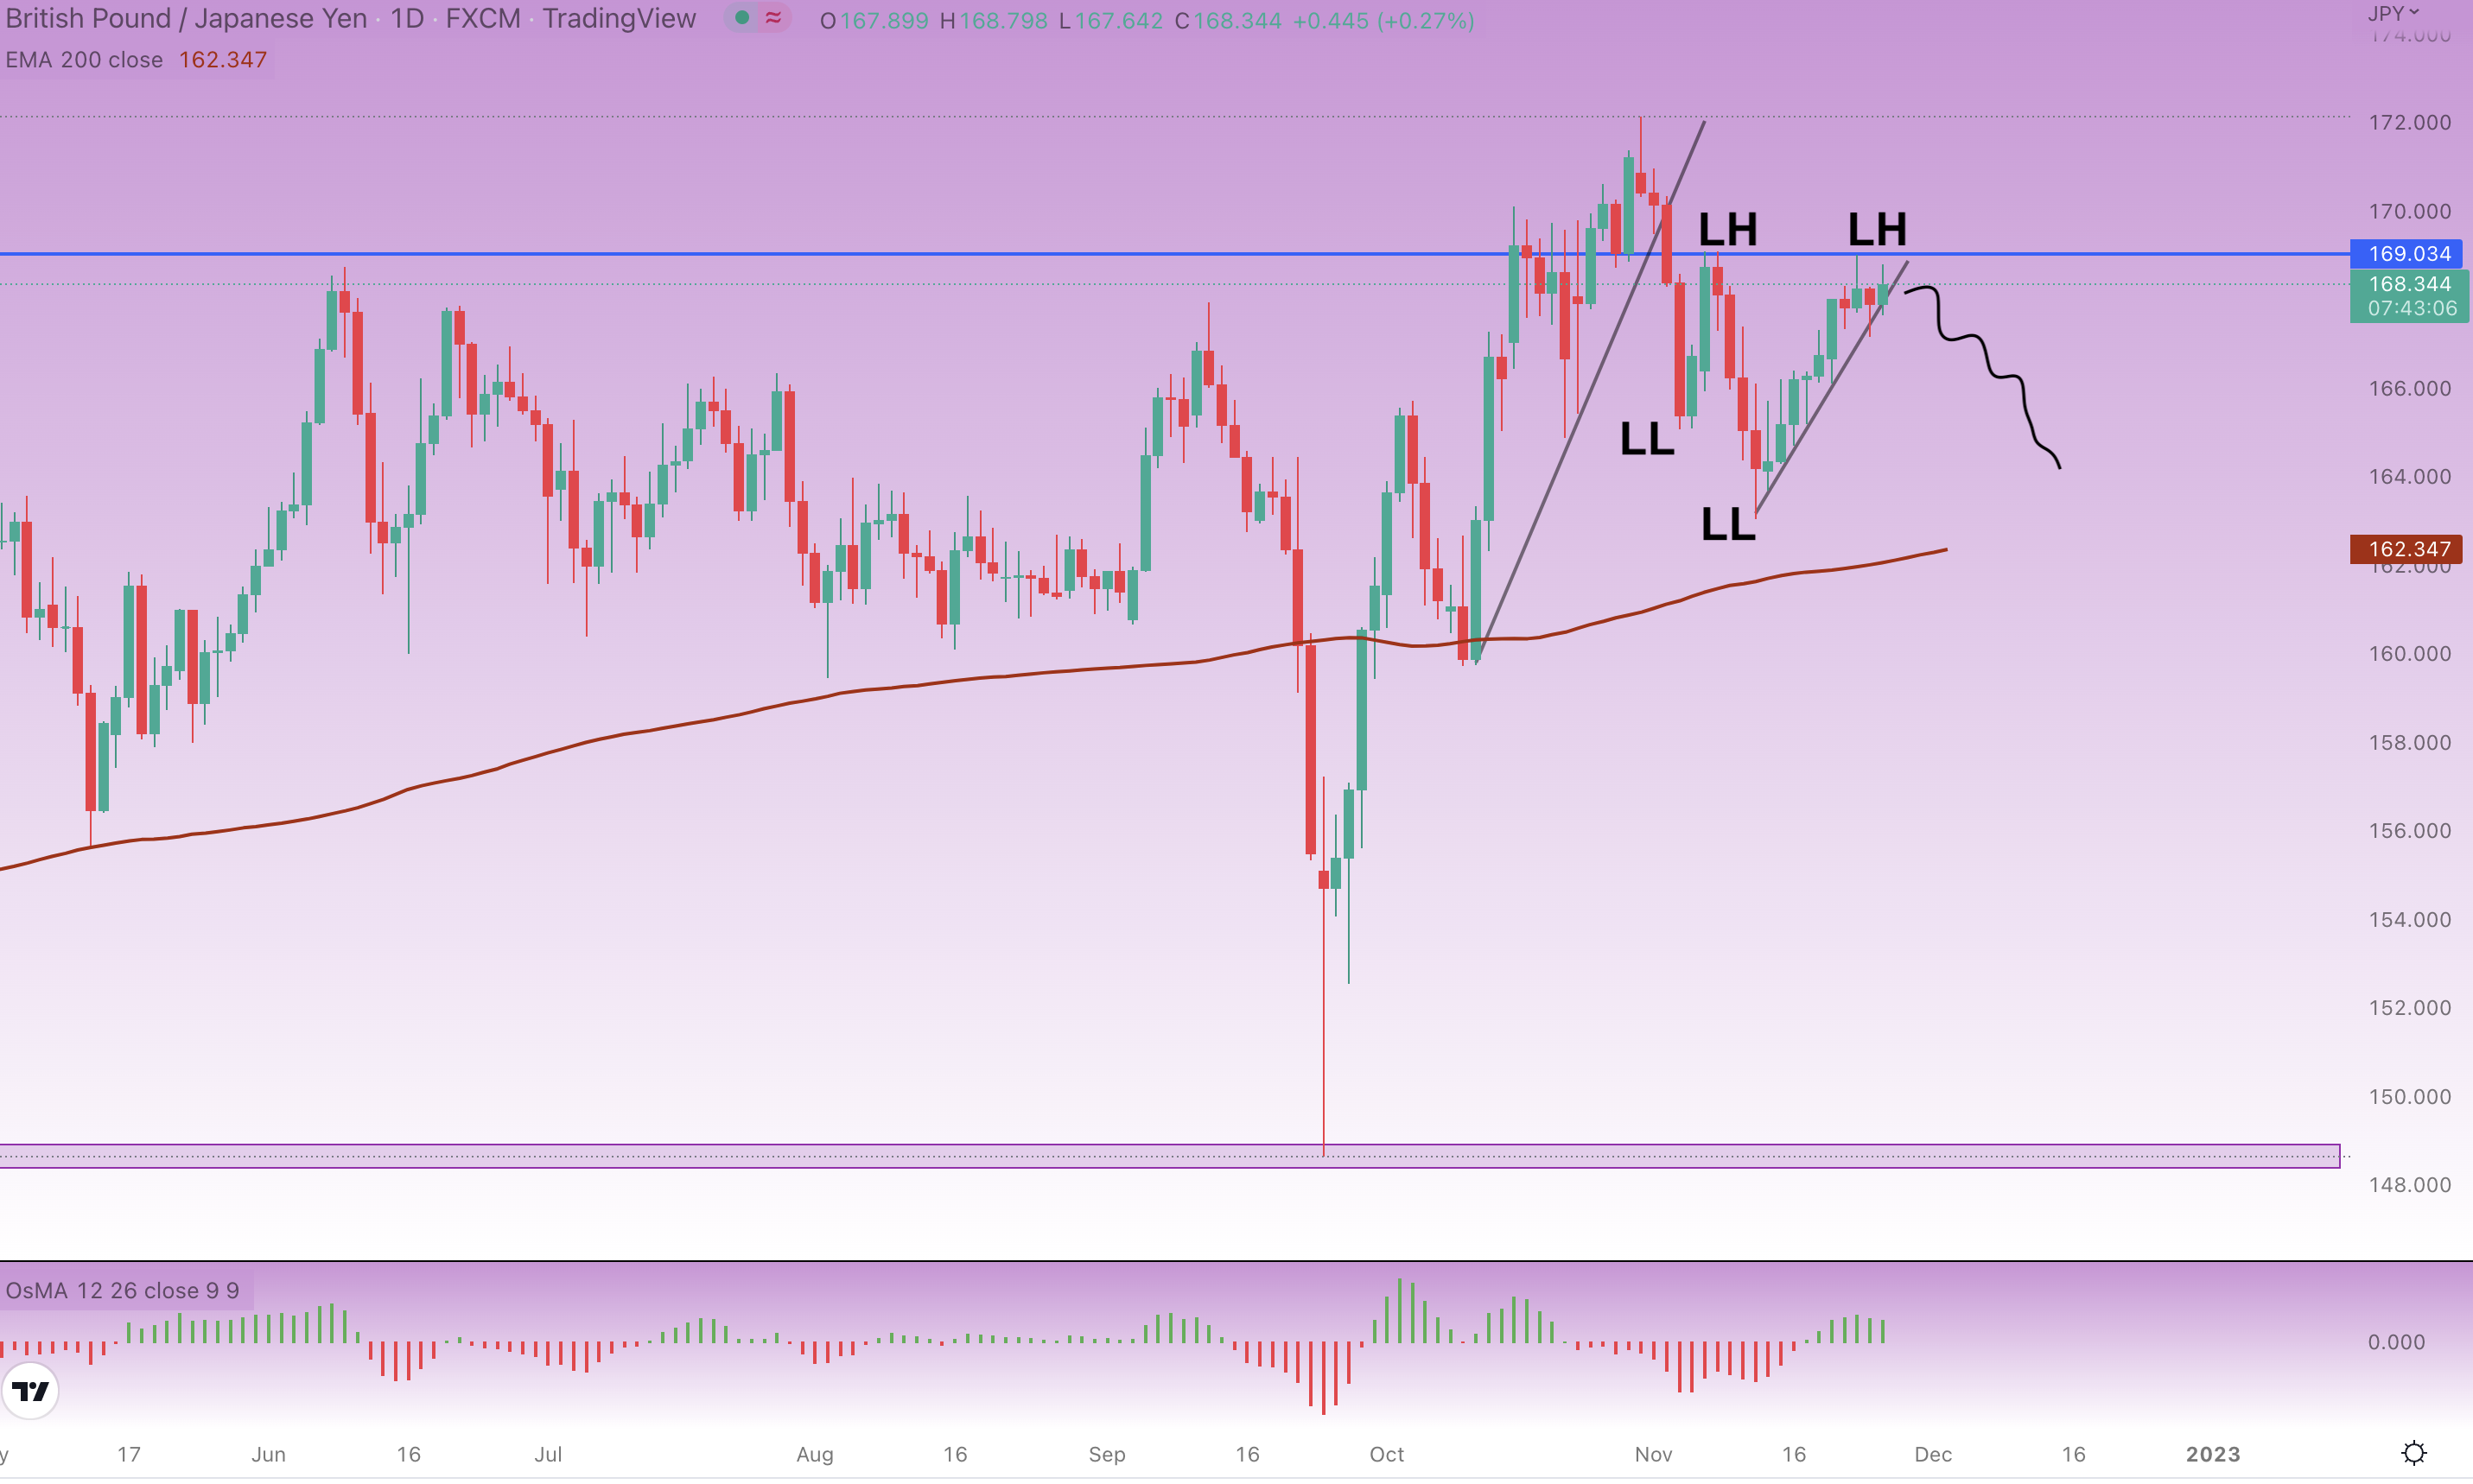
There is an obvious trend line in the chart, which reminds what happened the last time. When the first trend line in the chart was broken, GBP/JPY dropped by approximately 700 pips. If the second trend line is broken too, we could see the currency pair moving to EMA200. That is a potential move of more than 500 pips, while 100-pip stoploss should be sufficient.
Bottom line
The end of the year typically brings trend reversals, so traders should keep that in mind. Moreover, technical analysis suggests great trading signals, but make sure you wait for confirmations to avoid unnecessary losses. Protect capital at all costs.
Author

Rene Remsik
Investro
Rene got into financial markets by accident in 2012 and started with Forex trading. Later in 2017, he started investing in stocks in cryptocurrencies and began writing articles professionally.


