Fed Continues on High Side of Sideways in Stimulus Since End of 2019

As I have been following, the big event in the past 4.5 months has been the Fed moving back to aggressive stimulus since the repo crisis. The printing of money to buy repos and T-bills reached a peak of $424 billion in late December and has moved sideways since and was at $418 billion last Thursday.
At first it was emergency funding of repos. Then it was increasing old-fashioned QE through buying T-bills to replenish bank reserves so they could fund the repo market again. As a result, for the past few weeks repo funding has declined and the approximate $80 billion a month in T-bill QE has mostly just offset that decline.
It does appear the Fed is committed to this $80 billion in QE for the near future. The trillion-dollar question is: Do repos rise again in needed funding, or continue to fall and offset the QE?
And recall: it doesn’t matter what the Fed buys – repos, T-bills, T-bonds, etc.—it is adding new money to the pool of financial assets and pushes them up and it always ends up most in stocks.
Hence, the stock market has been rising on a 2.5 – 3.0-week lag since the mid-September QE surge, now higher than peak QE in 2014 at $60 billion a month.
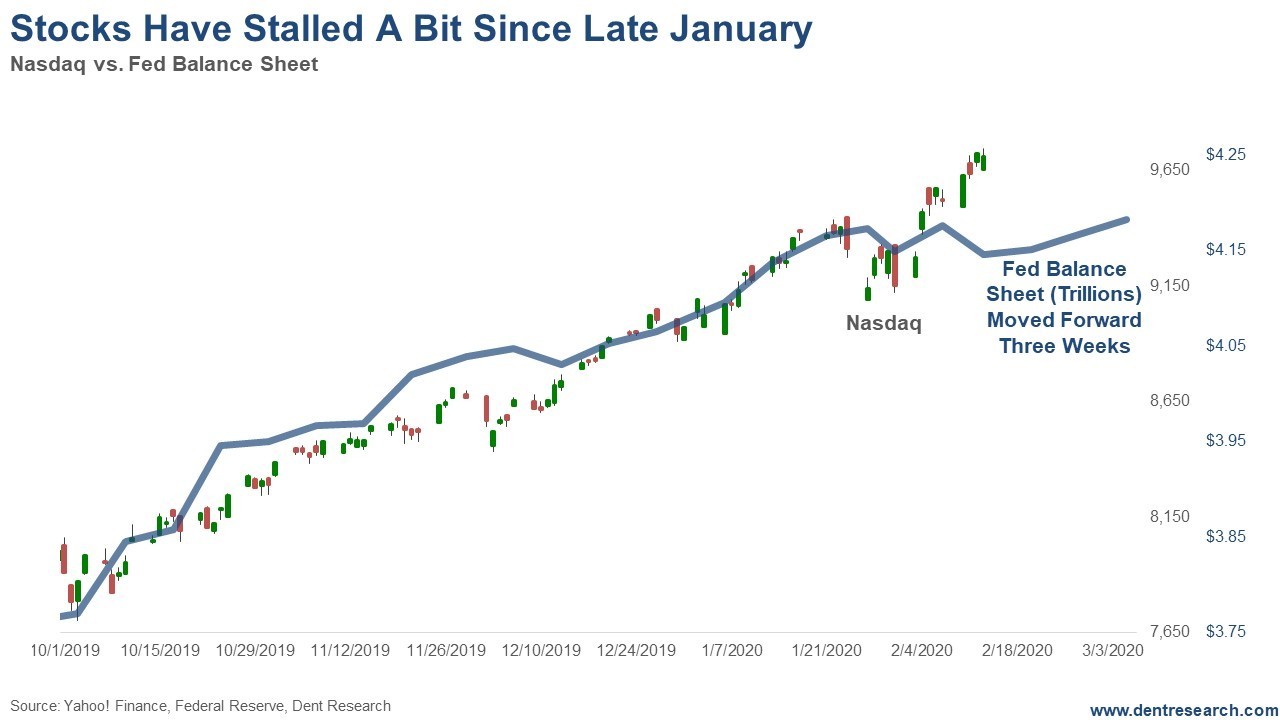
Here’s the new indicator that we update every Thursday evening for the net rise or fall in the Fed balance sheet and its close correlation with stocks on a lag. Stocks are now at the highest point — 9,748 on the Nasdaq recently — compared to this indicator that has been more sideways since it peaked at $424 billion.
Given the Fed’s pause since over the last 5 weeks, I would expect a correction in the coming weeks, likely into late February or early March. If that correction can hold close to the lows of 9,200 on the Nasdaq on January 27, down 7% or so, that would be bullish…
But the most bullish sign would be if net injections, or buying of assets, starts to rise again to new heights.
We will keep you updated. This is our most important short-term indicator on bubble watch.
I still see the markets going higher as we have not yet reached the top exponential trend-line for the Nasdaq which is about 10,000 today and will head towards just above 11,000 by the election. That is when the markets get to a higher risk of a bubble top.
I see a range between late May and February of 2021, with August to October as the most likely final top at this point. A final throw-over rally could take the Nasdaq higher than these targets before the first 40%+ crash that ends the bubble.
Author

Harry S. Dent, MBA
Dent Research
Harry S. Dent Jr. studied economics in college in the ’70s, but found it vague and inconclusive. He became so disillusioned by the state of his chosen profession that he turned his back on it.


