Fastly Inc. ($FSLY) correcting the march 2020 cycle
The Corona Virus has provided some amazing opportunities for certain sectors. Cloud computing is one of those sectors that have vastly outperformed the marketplace since the March 2020 low. Fastly Inc is in the cloud computing business and has been on a tear since the all time lows that were printed in March 2020. Lets take a look at what the company does:
"Fastly, Inc. is an American cloud computing services provider. Fastly's edge cloud platform provides a content delivery network, Internet security services, load balancing, and video & streaming services. Fastly's headquarters are in San Francisco, California, with additional offices in Denver, New York, Portland, London, and Tokyo.
Fastly describes their network as an edge cloud platform, which is designed to help developers extend their core cloud infrastructure to the edge of the network, closer to users. The Fastly edge cloud platform includes their content delivery network, image optimization, video & streaming, cloud security, and load balancing services.
Fastly's cloud security services include distributed denial of service (DDoS) attack protection, bot mitigation, and a web application firewall. Fastly web application firewall uses the OWASP ModSecurity Core Rule Set (CRS) alongside its own ruleset."
FSLY is counting clean off the March 2020 all time low low, lets take a look at the 4H chart below.
Fastly 4H Elliott Wave View:
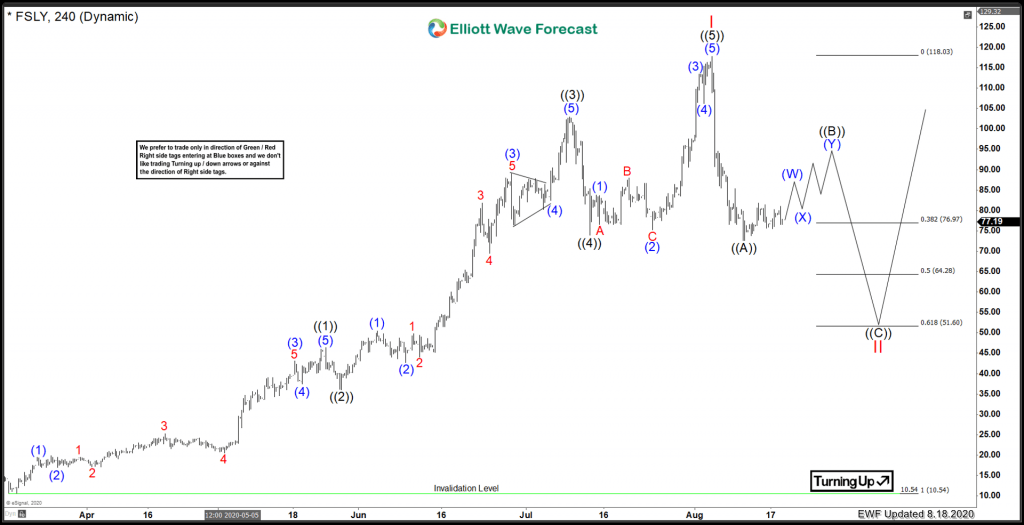
Fastly has not been public that long, and doesn't have much historical data. It set an all time low in March 2020, and has rallied impulsively off that low.
Medium term term view from 3/16/2020 lows of 10.54. Wave ((1)) is set at 46.35 on 5/22/2020 and wave ((2)) at 36.03 on 4/27/2020. After that, an extended Black ((3)) took place, which topped on 7/09/2020 at 102.95. After that, Black ((4)) at 73.87 on 7/14/2020. From there, Black ((5)) of Red I is favoured peaked on 8/05/2020 at 117.79.
In conclusion, wave ((A)) of Red II is favoured set at the low 72.55 on 8/11/2020. A bounce up in ((B)) is now underway. However, there is no extreme area to measure from a ((B)) high since it is still ongoing. An area that Red II can form a low is the 50% to 61.8% retrace area of 64.28 to 51.60. After ((B)) is set, a more accurate equal leg measurement can be taken for where Red II may bottom.
Risk Management
Using proper risk management is absolutely essential when trading or investing in a volatile stocks. Elliott Wave counts can evolve quickly, be sure to have your stops in and define your risk when trading.
Author

Elliott Wave Forecast Team
ElliottWave-Forecast.com


