Existing Home Sales Fail to Propel Markets

Good Morning Traders,
As of this writing 4 AM EST, here's what we see:
US Dollar: Jun. USD is Up at 97.230.
Energies: July Crude is Down at 42.44.
Financials: The Sept 30 year bond is Up 3 ticks and trading at 156.19.
Indices: The June S&P 500 emini ES contract is 15 ticks Lower and trading at 2429.75.
Gold: The Aug gold contract is trading Up at 1253.60. Gold is 78 ticks Higher than its close.
Initial Conclusion
This is not a correlated market. The dollar is Up+ and crude is Down- which is normal and the 30 year bond is trading Higher. The Financials should always correlate with the US dollar such that if the dollar is lower then bonds should follow and vice-versa. The indices are Down and Crude is trading Down- which is not correlated. Gold is trading Up+ which is not correlated with the US dollar trading Up+. I tend to believe that Gold has an inverse relationship with the US Dollar as when the US Dollar is down, Gold tends to rise in value and vice-versa. Think of it as a seesaw, when one is up the other should be down. I point this out to you to make you aware that when we don't have a correlated market, it means something is wrong. As traders you need to be aware of this and proceed with your eyes wide open.
At this hour Asia is trading mixed with half the exchanges trading Higher and the other half Lower. All of Europe is trading Lower at this hour.
Possible Challenges To Traders Today
– Unemployment Claims are out at 8:30 AM EST. This is major.
– HPI m/m is out at 9 AM EST. This is major
. – FOMC Member Powell Speaks. This is major.
– CB Leading Index m/m is out at 10 AM EST. This is major
– Natural Gas Storage is out at 10:30 AM EST. This is major.
Treasuries
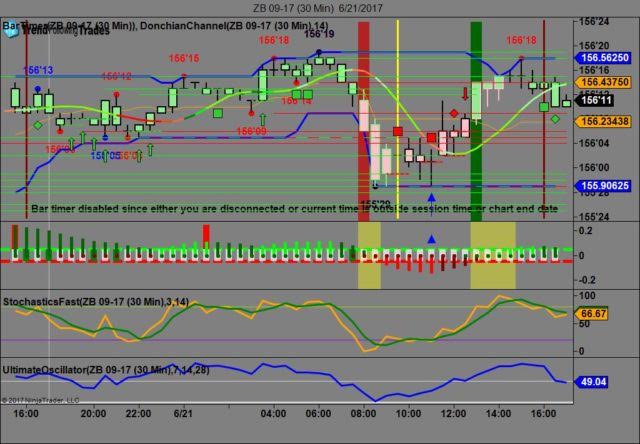
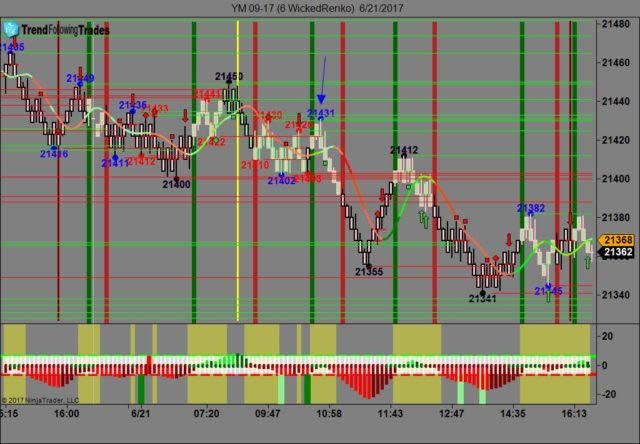
We've elected to switch gears a bit and show correlation between the 30 year bond (ZB) and The YM futures contract. The YM contract is the DJIA and the purpose is to show reverse correlation between the two instruments. Remember it's liken to a seesaw, when up goes up the other should go down and vice versa.
Yesterday the ZB made it's move at around 11 AM EST with no real economic news in sight. The ZB hit a low at around that time and the YM hit a high. If you look at the charts below ZB gave a signal at around 11 AM and the YM was moving lower at the same time. Look at the charts below and you'll see a pattern for both assets. ZB hit a low at around 11 AM and the YM hit a high. These charts represent the newest version of Trend Following Trades and I've changed the timeframe to a 30 minute chart to display better. This represented a long opportunity on the 30 year bond, as a trader you could have netted about 20 ticks per contract on this trade. Each tick is worth $31.25. We added a Donchian Channel to the charts to show the signals more clearly. Please note that the front month for the ZB contract is now September, 2017.
Charts Courtesy of Trend Following Trades built on a NinjaTrader platform
Bias
Yesterday we gave the markets a downside bias and the markets didn't disappoint as the Dow dropped 57 points, the S&P dropped 1 but the Nasdaq gained 46. Today we aren't dealing with a correlated market and our bias is to the downside.
Could this change? Of Course. Remember anything can happen in a volatile market.
Commentary
Yesterday we gave the markets a downside bias as the USD, Bonds and Gold were all trading higher yesterday morning and this does not bode well for an upside day hence the downside bias. In other news Existing Home Sales came in at 5.62 mil versus 5.54 mil expected thereby beating expectations. This however wasn't enough to propel the Dow forward and as such the DJIA retreated falling 57 points. As we often say in a situation like this our rules of Market Correlation prevails, which is why we use them.
Author

Nick Mastrandrea
Market Tea Leaves


