Excuse me, Mr. gold, what year is it?

Although your calendar may say otherwise, gold is in the 1960s. The question is whether we will move into the 1970s or speed-run to the mid-2010s.
Did you go overboard with your time travel and lose track of time? Probably not, but just in case, I assure you that the current year is 2021. To be 100% sure, I fact-checked it on a dedicated webpage for time-travelers. However, the authority of science is being questioned, and there are people who say that, from a macroeconomic point of view, we are approaching the 1970s, or at least the 1960s. There are also voices saying that the gold market is replaying 2012-2013. Although appearances point to 2021, let’s investigate what year we really live in.
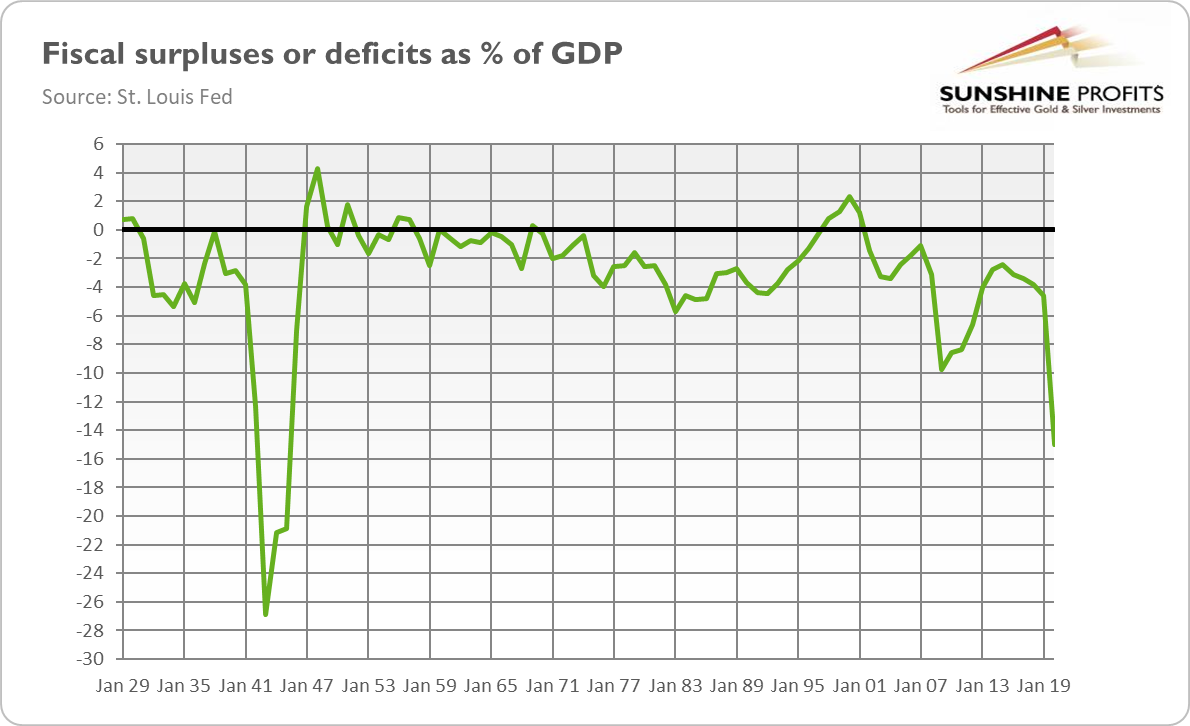
The similarities with the 1970s are obvious. Just like then, we have high inflation, large fiscal deficits (see the chart below), and easy, erroneous monetary policy. Fifty years ago, the Fed blamed inflation on exogenous shocks and considered inflation to be transitory too. The new monetary regime adopted by the US central bank in 2020 also takes us back to the 70s and the mistaken belief that the economy cannot overheat, so the Fed can let inflation run above the target for a while in order to boost employment.
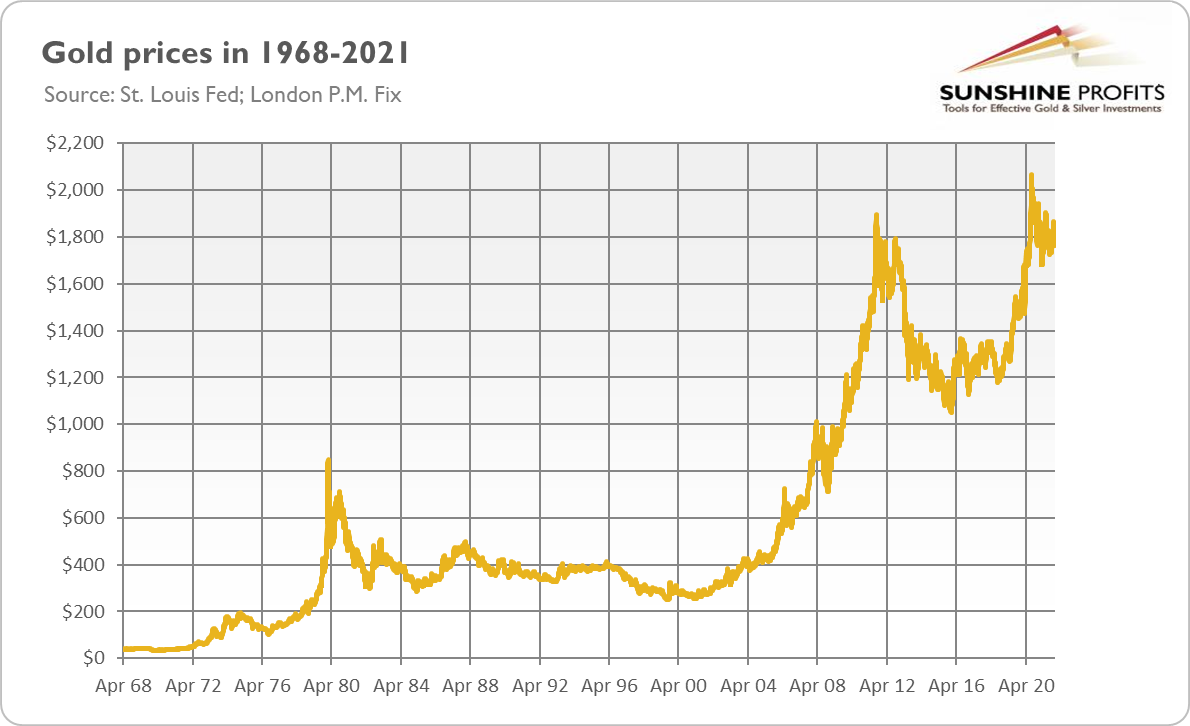
The parallels extend beyond price pressure. The withdrawal of US troops from Afghanistan reminded many of the fall of Saigon. The world is facing an energy crisis right now, another feature of the 1970s. If we really repeat those years, gold bulls should be happy, as the yellow metal rallied from $35 to $850, surging more than 2300% back in that decade (see the chart below).
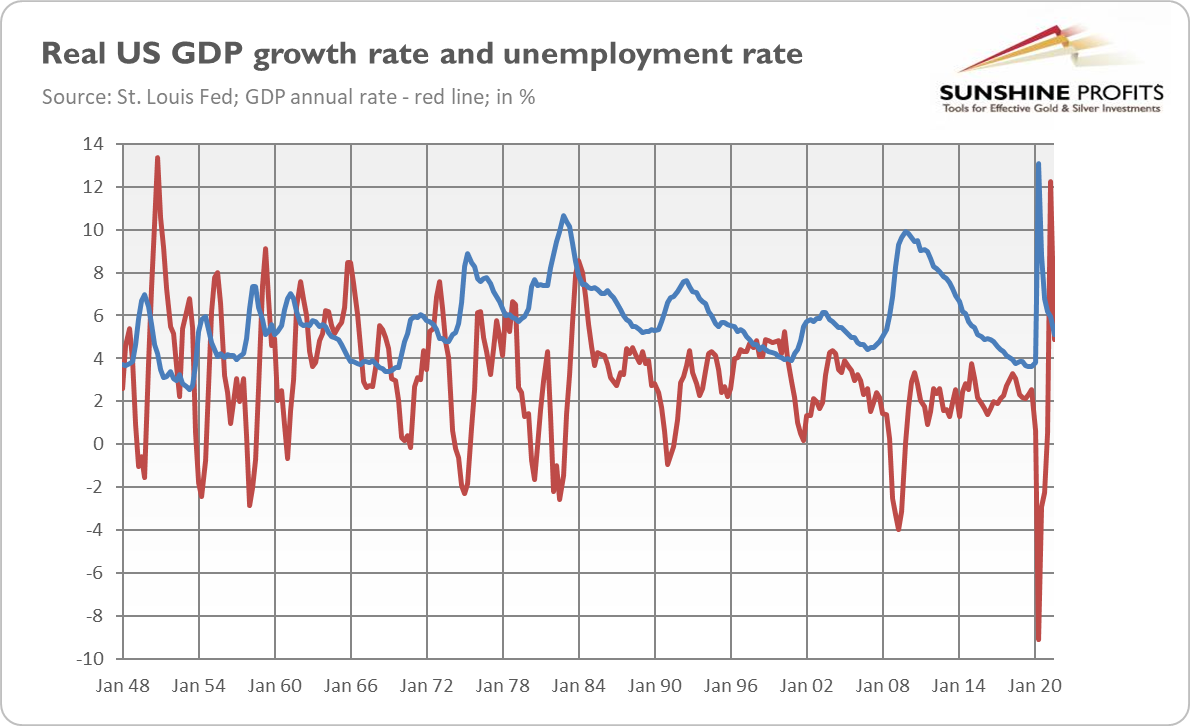
However, there is one problem with this narrative. In the 1970s, we experienced stagflation, i.e., a simultaneous occurrence of high inflation and economic stagnation with a rising unemployment rate. Currently, although we face strong upward price pressure, we enjoy economic expansion and declining unemployment, as the chart below shows. Indeed, the monthly unemployment rate decreased from 14.8% in April 2020 to 4.2% in November 2021.
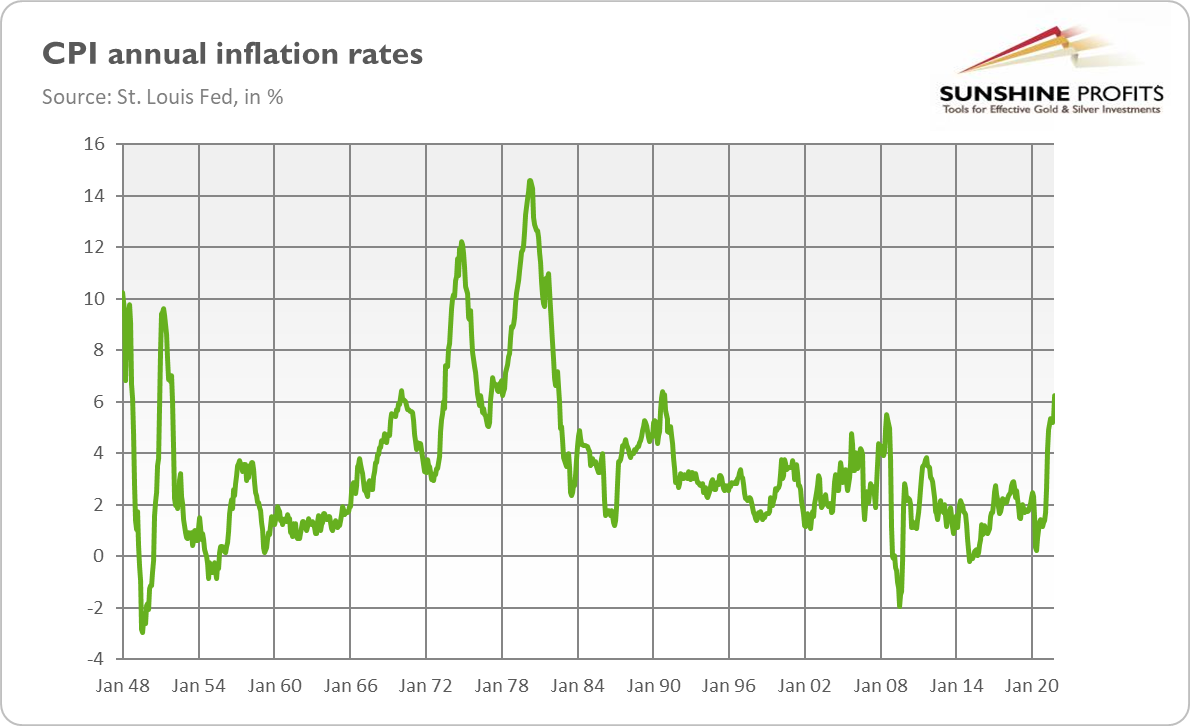
The current macroeconomic situation, characterized by inflation without stagnation part, is reminiscent of the 1960s, a decade marked by rising inflation and rapid GDP growth. As the chart below shows, the CPI annual rate reached a local maximum of 6.4% in February 1970, similar to the current inflation level.
Apparently, we are replaying the 1960s right now rather than the 1970s. So far, growth is slowing down, but we are far from stagnation territory. There is no discussion on this. My point was always that the Fed’s actions could bring us to the 1970s, or that complacency about inflation is increasing the risk of de-anchoring inflation expectations and the materialization of a stagflationary scenario. In the 1960s, the price of gold was still fixed, so historical analysis is impossible.
However, it seems that gold won’t start to rally until we see some signs of stagnation or an economic crisis, and markets begin to worry about recession. Given that the current economic expansion looks intact, the yellow metal is likely to struggle at least by mid-2022 (unless supply disruptions and energy crisis intensify significantly, wreaking havoc).
Do we have to go back that far in time, though? Maybe the 2020 peak in gold prices was like the 2011 peak and we are now somewhere in 2012-2013, on the eve of a great downward move in the gold market? Some similarities cannot be denied: the economy is recovering from a recession, while the Fed is tightening its monetary policy, and gold shows weakness with its inability to surpass $1,800. So, some concerns are warranted. I pointed out a long time ago the threat of an upward move in the real interest rates (as they are at record low levels), which could sink the precious metals market.
However, there are two key differences compared to the 2012-2013 period. First, inflation is much higher and it’s still accelerating, while ten years ago there was disinflation. This distinction should support gold prices. The peak in the inflation rate could be a dangerous time for gold, as the disinflationary era would raise interest rates, putting downward pressure on the yellow metal.
Second, the prospects of the Fed’s tightening cycle are probably already priced in. In other words, the next “taper tantrum” is not likely to happen. It implies that a sudden spike in the interest rates similar to that of 2013 (see the chart below) shouldn’t repeat now.
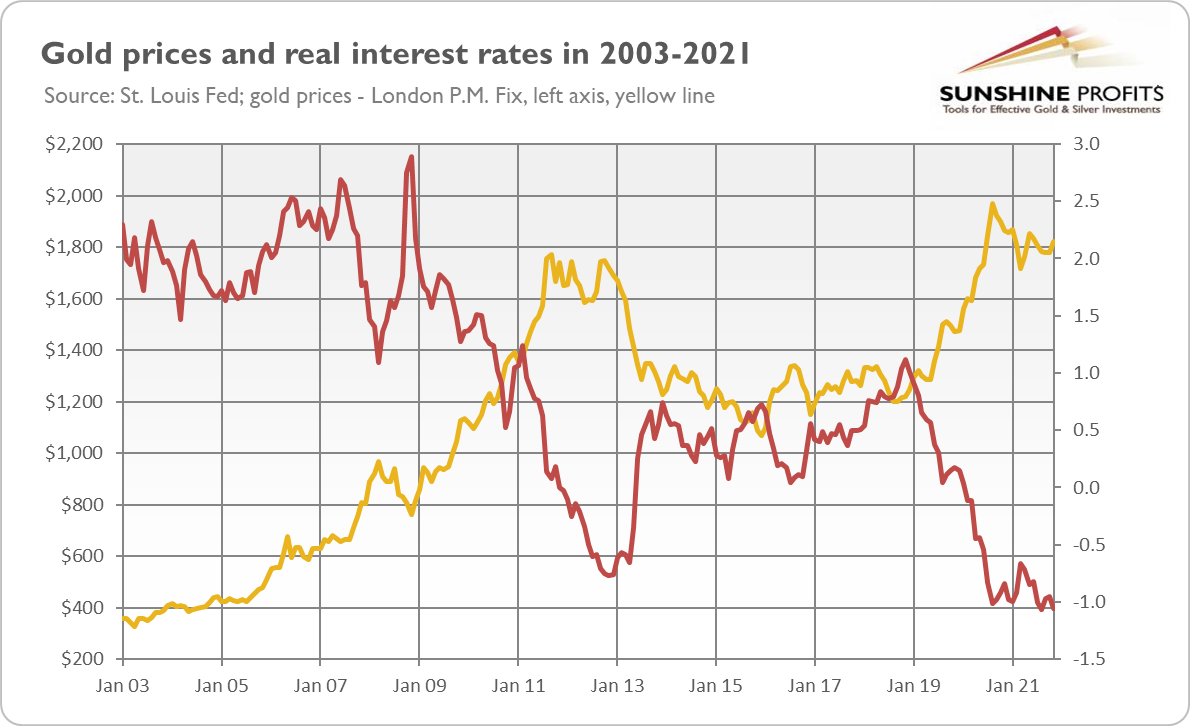
Hence, the answer to the question “what year is it?” should be that we are somewhere in the 1960s and we can move later into the 1970s if high inflation stays with us and stagnation sets in or if the next crisis hits. However, we can leap right into the 2010s if inflation peaks soon and the hawkish Fed triggers a jump in bond yields. It’s also possible that we will see a temporary disinflation before the second wave of elevated inflation. So, gold could continue its struggle for a while before we see another rally.
Want free follow-ups to the above article and details not available to 99%+ investors? Sign up to our free newsletter today!
Want free follow-ups to the above article and details not available to 99%+ investors? Sign up to our free newsletter today!
Author

Arkadiusz Sieroń
Gold Price Forecast
Arkadiusz Sieroń received his Ph.D. in economics in 2016 (his doctoral thesis was about Cantillon effects), and has been an assistant professor at the Institute of Economic Sciences at the University of Wrocław since 2017.
















