Everyone blames inflation for the bond rout. They're looking at the wrong line
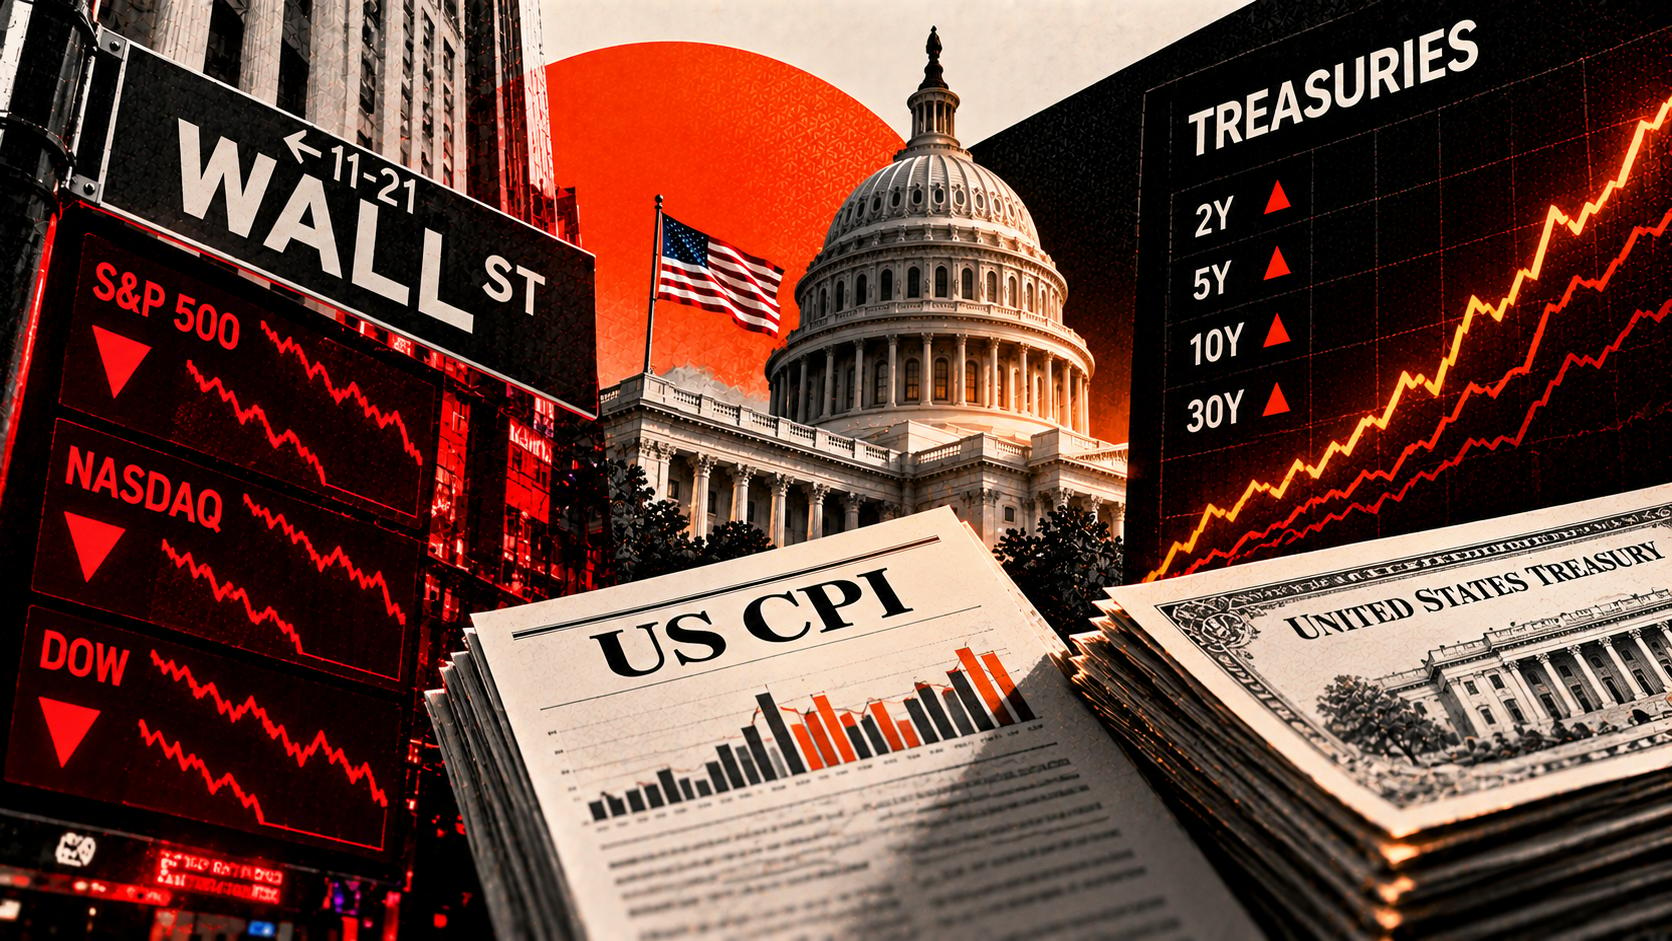
The US 10-year Treasury yield has risen from under 4% in March to a peak above 5.30% in early October, a level last seen in 2002. The explanation on offer is inflation: the Consumer Price Index (CPI) up 3.7% in a year, the Producer Price Index (PPI) up 6.3%, and Oil above $100 because of the attacks on tankers in the Strait of Hormuz. The bond market's own measure of expected inflation says otherwise. A Treasury Inflation-Protected Security (TIPS) is a Treasury whose payments rise with the CPI. The gap between its yield and an ordinary ten-year Treasury's is the inflation rate investors expect to average over the decade, and that gap is 2.35%, a tenth of a point above where it started the year. Nearly the whole rise in yields is in the other line, the inflation-adjusted yield, which is what a bond pays after inflation is taken out. That line is at its highest since 2008.
Two lines, and only one of them moved
A Treasury yield is two numbers added together: what investors expect inflation to average over the life of the bond, and what they want to earn on top of it. TIPS separate the two, so their yield is the second number on its own. At the end of 2025, the 10-year yield was 4.18%, made of a 1.93% inflation-adjusted yield and 2.25% of expected inflation. On October 16 it was 5.09%, made of 2.74% and 2.35%. Of the 0.91 of a point added this year, 0.81 came from the inflation-adjusted line.
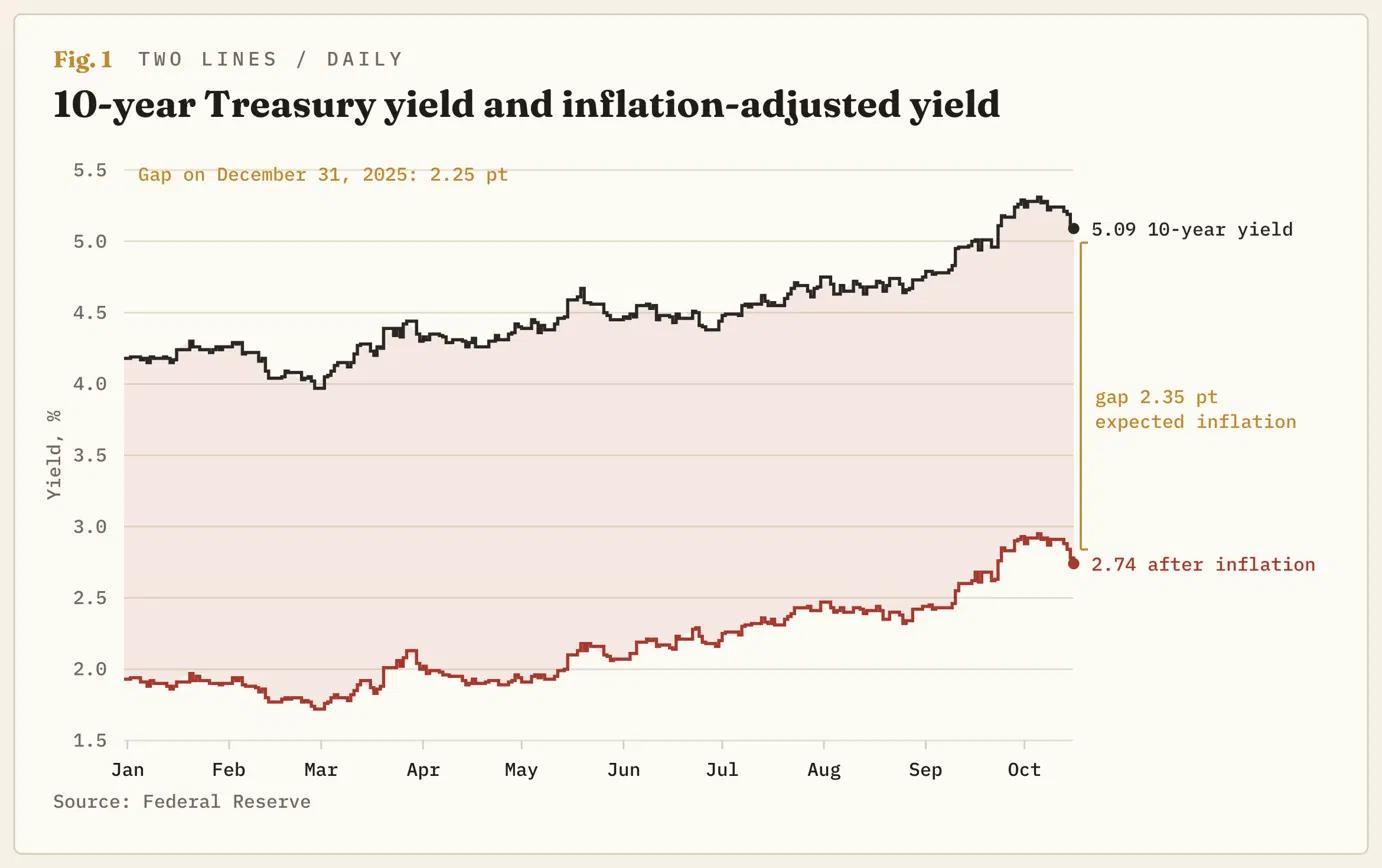
The September leg was purer still. From September 10 to the October 5 peak, the 10-year rose 0.36 of a point, the inflation-adjusted yield rose 0.40, and expected inflation fell 0.04. Then the September inflation reports landed, CPI on October 14 and PPI on October 15, the hottest of the year. Over that week the 10-year fell 0.15 of a point and the expected-inflation gap rose 0.02. The numbers everyone was waiting for arrived on the two days they were scheduled for, and the line that measures expected inflation moved two hundredths of a point.
The inflation-adjusted yield peaked at 2.95% on October 5, a level last seen in November 2008. The ordinary 10-year yield is at a 2007 high and the inflation-adjusted one at a 2008 high, which is what a rout looks like when one of its two parts is stationary.
Who expects what, and the Fed's part in it
Investors expect inflation to average 2.38% over the next five years. The CPI is running at 3.7%. Households surveyed by the University of Michigan (UoM) in October expect 4.7% over the next year and 3.5% a year over the next five. In March 2022, the bond market's five-year figure was 3.4%, above the households' 3.0%. It is now 1.1 points below them, and the group with money on the number has the lower one.
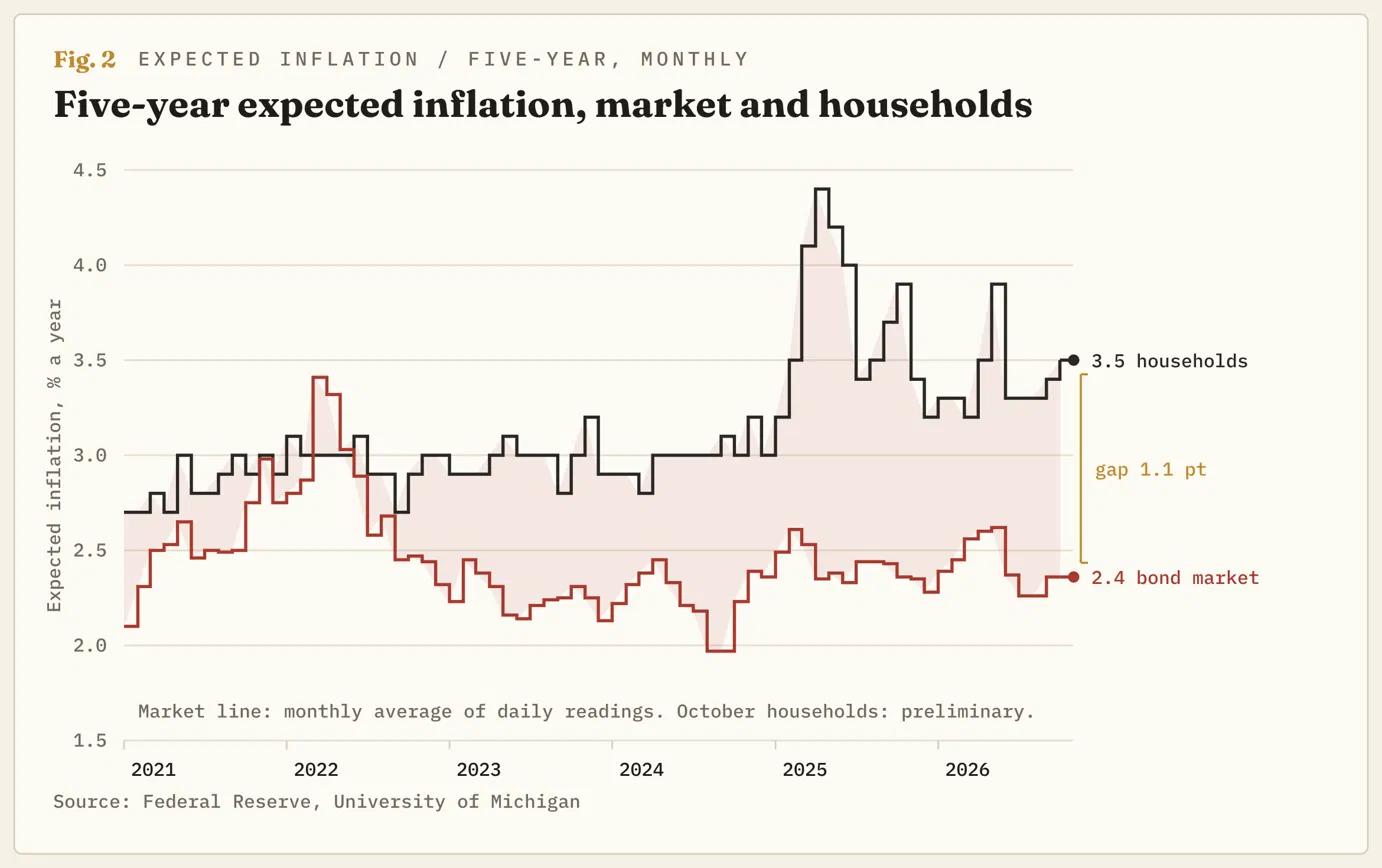
The Federal Reserve (Fed) asked for this. Fed Chair Warsh said after the September 16 rate rise that the point was to keep the inflation built into market prices low and expectations steady. The minutes of that meeting record the staff's view that market pricing is consistent with inflation returning to 2%. They also record that most of the committee expected another rise by the end of the year. The Fed raised rates to keep the market's inflation expectation low, the market's inflation expectation is low, and the Fed expects to raise rates again anyway.
TIPS trade less than ordinary Treasuries, so the gap understates expected inflation a little. The Cleveland Fed's model corrects for that and still has inflation under 3% a year from now and at 2.73% over ten. The same bank's nowcast has the CPI running at a 5% annual rate in the fourth quarter, so the year the market expects starts with a quarter at 5%.
Why the Dollar follows this line and not the other
A yield that rises because inflation is expected to rise doesn't bring money into a currency, because the extra interest is paid in money losing value at the same rate. A yield that rises after inflation does. The Dollar Index has risen from a February low near 95.50 to an October peak near 103.00. Its September-October leg, from about 98.50 to the peak, ran alongside the 0.40 rise in the inflation-adjusted 10-year yield. It has given back nearly a third of that leg since the inflation reports, over the same days in which the inflation-adjusted yield fell 0.17 of a point.
Nor is the inflation-adjusted rise a demand for extra pay to lend for ten years rather than roll short-term loans; the New York Fed's model of that premium has it up 0.01 of a point this year. What's left is the expected path of the Fed's own rate. Investors expect it to stay near 4% for years, in line with the Fed's own September projections. The Dollar is trading on a Fed that holds, not on inflation that persists.
Thursday's auction puts a price on the line
The Treasury sells $26 billion of a new five-year TIPS on Thursday. The five-year inflation-adjusted yield is near 2.55%, and no five-year TIPS auction since 2008 has sold above 2.44%, the October 2023 result. The ten-year TIPS auction on September 17 came at 2.653%, the highest since October 2008. It drew 2.24 bids for every one filled, against about 2.6 at the five-year sales this year. The yield came in 0.02 of a point above where the bond traded beforehand, which is buyers holding out for a discount.
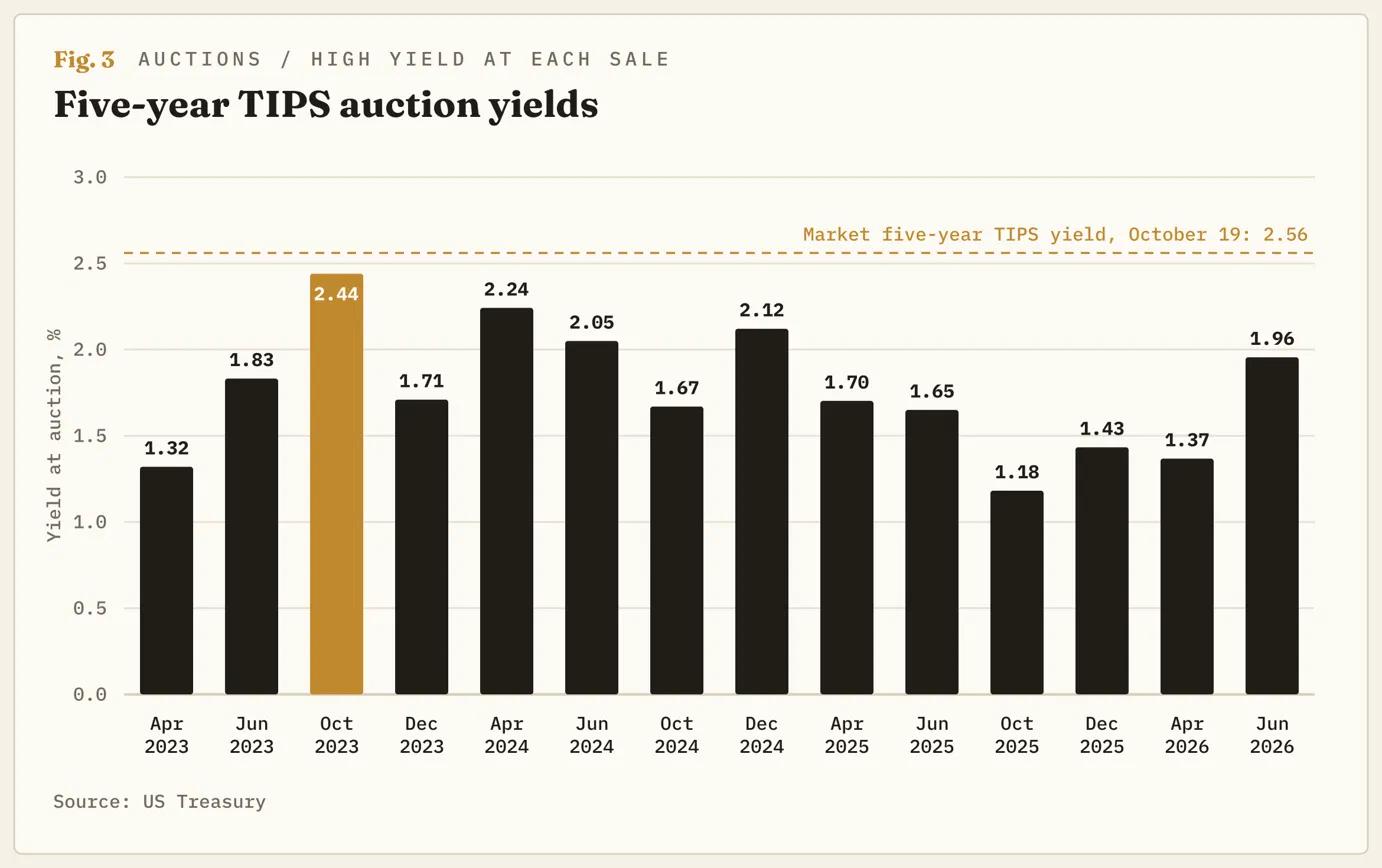
The auction tests the thesis directly, because TIPS are the inflation line. Strong demand at a 2008-era yield, bids above 2.6 per dollar sold and a result at or below the pre-auction level pushes the protected yield down and the expected-inflation gap up. That is the inflation line starting to move. Weak demand, a result above the pre-auction level and bids below 2.3, means investors are declining inflation protection at the best price in eighteen years. The inflation-adjusted line then goes on carrying the whole move. Investors who fear inflation are being paid more to hold protection than at any time since 2008, and the price says they expect to need very little.
The map
The 10-year has given back about three-fifths of its September-October rise, from the peak above 5.30% to near 5.10%. The daily Stochastic Relative Strength Index (Stoch RSI), a momentum gauge, has turned down from the stretched reading it carried into the peak. The run since March is a sequence of higher lows, and the one level that changes the reading is 5.00%, which the yield first reached on September 15 and has traded above throughout October.
The position is that the 10-year holds above 5.00% and the Dollar Index above 100.00 while the inflation-adjusted yield stays above 2.50%. That line falls when investors expect the Fed to cut, not when a CPI report cools. A close below 5.00% with the expected-inflation gap unchanged is a growth scare of the kind that showed in the week of October 12. That is a reason to own bonds, not a reason to sell the Dollar. The argument fails if the five-year expected-inflation gap rises through 2.70%, the May high. That is the inflation line joining the move: ordinary yields rising while the inflation-adjusted yield falls, and the Dollar losing the thing that took it to 103.00. Until it does, the rout is a bet on the Fed, and the Fed meets on October 28.
Author

Joshua Gibson
FXStreet
Joshua joins the FXStreet team as an Economics and Finance double major from Vancouver Island University with twelve years' experience as an independent trader focusing on technical analysis.