EUR/USD, USD/JPY, AUD/USD, WTI, US500 cash, XAU/USD

EUR/USD daily chart
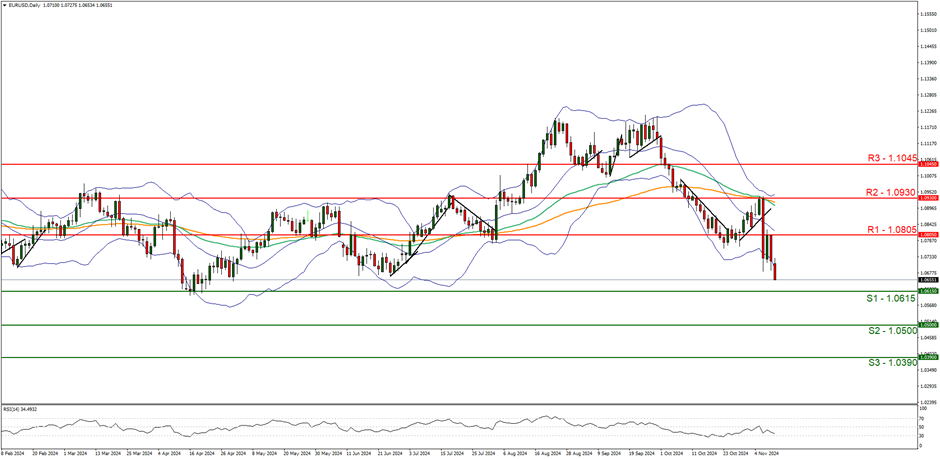
Support: 1.0615 (S1), 1.0500 (S2), 1.0390 (S3).
Resistance: 1.0805 (R1), 1.0930 (R2), 1.1045 (R3).
EUR/USD appears to be moving in a downwards trajectory, with the pair currently taking aim for our 1.0615 (S1) support level. We opt for a bearish outlook for the pair and supporting our case is the death cross that has formed where the 50MA has crossed below the 100MA implying bearish market tendencies. Moreover, the RSI indicator below our chart currently registers a figure near 30, implying strong bearish market tendencies as well. For our bearish outlook to continue, we would require a break below the 1.0615 (S1) support level, with the next possible target for the bears being the 1.0500 (S2) support base. On the flip side for a sideways bias we would require the pair to remain confined between the 1.0615 (S1) support level and the 1.0805 (R1) resistance line. Lastly,for a bullish outlook we would require a clear break above the 1.0805 (R1) resistance line, with the next possible target for the bulls being the 1.0930 (R2) resistance ceiling.
USD/JPY daily chart
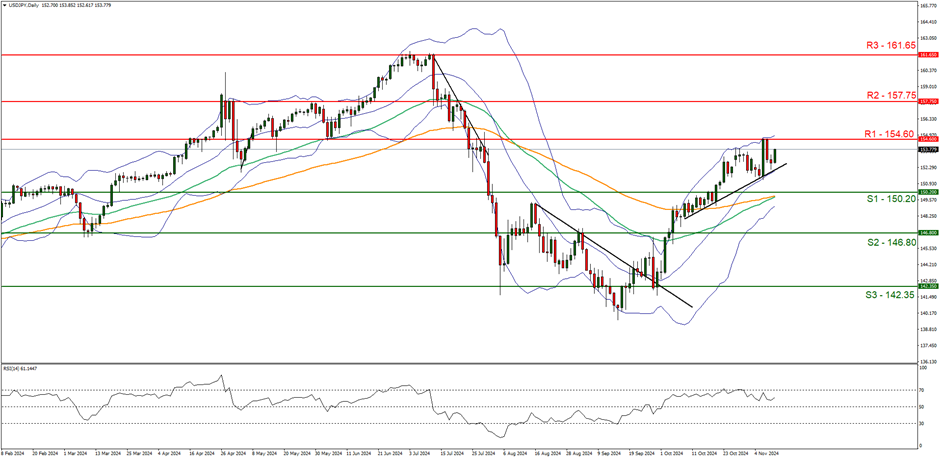
Support: 150.20 (S1), 146.80 (S2), 142.35 (S3).
Resistance: 154.60 (R1), 157.75 (R2), 161.65 (R3).
The pair appears to be moving in an upwards fashion, with the pair currently appearing to be aiming for our 154.60 (R1) resistance line. We opt for a bullish outlook for the coin and supporting our case is the upwards moving trendline which was incepted on the 9th of October, in addition to the RSI indicator below our chart which currently registers a figure above 60, implying a bullish market sentiment. For our bullish outlook to continue, we would require a clear break above the 154.60 (R1) resistance line with the next possible target for the bulls being the 157.75 (R2) resistance ceiling. On the flip side for a sideways bias we would require the pair to remain confined between the 150.20 (S1) support level and the 154.60 (R1) resistance line. Lastly, for a bearish outlook we would require a clear break below the 150.20 (S1) support line with the next possible target for the bulls being the 146.80 (S2) support base.
AUD/USD daily chart
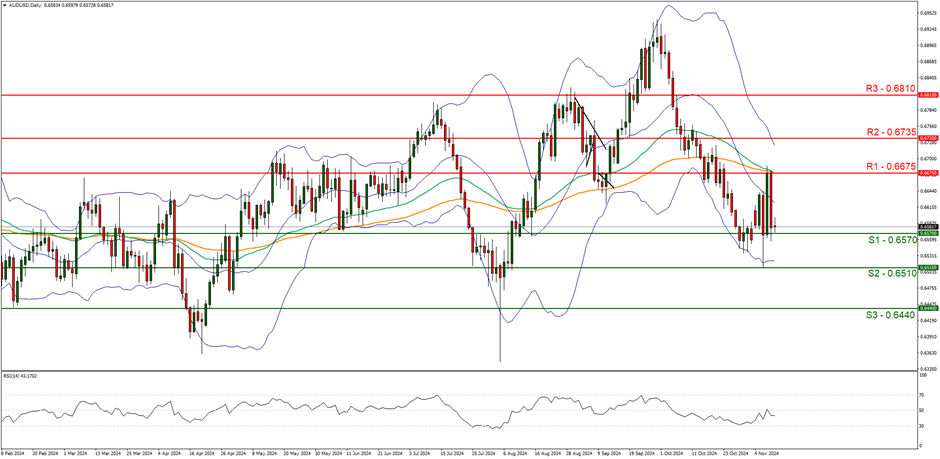
Support: 0.6570 (S1), 0.6510 (S2), 0.6640 (S3).
Resistance: 0.6675 (R1), 0.6735 (R2), 0.6810 (R3).
AUD/USD is a tricky one, as one can deduct from the price action. Yet in our view, the pair appears to be moving in a downwards fashion and supporting our case is the RSI indicator below our chart which currently registers a figure near 40, implying a bearish market sentiment. For our bearish outlook to continue, we would require a clear break below the 0.6570 (S1) support level if not also the 0.6510 (S2) support line, with the next possible target for the bears being the 0.6640 (S3) support base. On the flip side for a sideways bias, we would require the pair to remain confined between the sideways moving channel defined by the 0.6570 (S1) support line and the 0.6675 (R1) resistance level. Lastly, for a bullish outlook, we would require a clear break above the 0.6675 (R1) resistance line with the next possible target for the bulls being the 0.6735 (R2) resistance level.
WTI daily chart

Support: 64.75 (S1), 57.30 (S2), 49.30 (S3).
Resistance: 71.85 (R1), 78.00 (R2), 83.45 (R3).
On the commodities front, oil prices appear to be moving in a sideways fashion after failing to break above the 71.85 (R1) resistance line. We opt for a sideways bias for the commodity’s price and supporting our case is the narrowing of the Bollinger bands which tend to imply low market volatility in addition to the failure to break above our aforementioned resistance level. Yet, some caution is warranted with the RSI indicator below our chart currently registering a figure of 40 which tends to imply bearish market tendencies. Nonetheless, for our sideways bias to continue, we would require the commodity to remain confined between the sideways moving channel defined by the 64.75 (S1) support level and the 71.85 (R1) resistance line. On the flip side, for a bearish outlook we would require a clear break below the 64.75 (S1) support level, with the next possible target for the bears being 57.30 (S2) support base.
US500 daily chart

Support: 5885 (S1), 5675 (S2), 5400 (S3).
Resistance: 6150 (R1), 6385 (R2), 6620 (R3).
The S&P 500 is soaring to new all-time highs having broken above our resistance now turned to support at the 5885 (S1) level. We opt for a bullish outlook for the index and supporting our case is the RSI indicator below our chart which currently registers a figure near 70 implying a strong bullish market sentiment. For our bullish outlook to continue, we would require a break above the 6150 (R1) potential resistance level, with the next possible target for the bulls being the 6385 (R2) resistance line. On the flip side for a sideways bias, we would require the index to remain between the 5885 (S1) support level and the 6150 (R1) possible resistance level. Lastly, for a bearish outlook, we would require a clear break below the 5885 (S1) support level with the next possible target for the bears being the 5675 (S2) support line.
XAU/USD daily chart
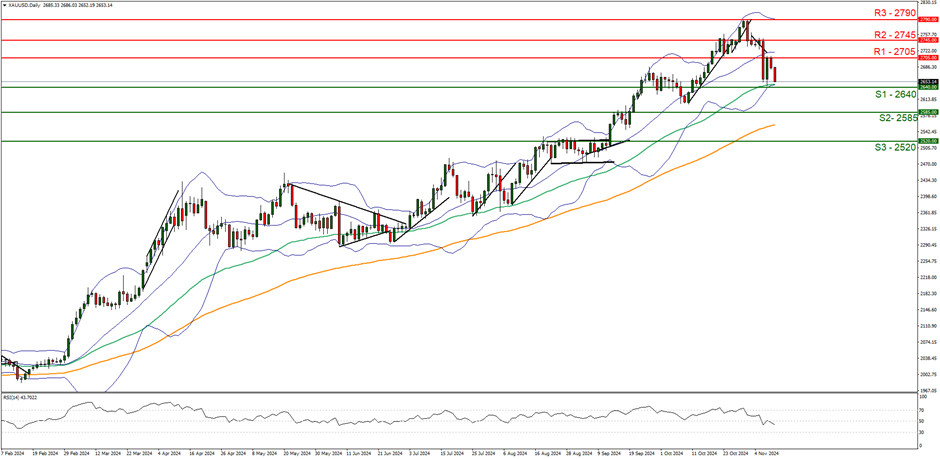
Support: 2640 (S1), 2585 (S2), 2520(S3).
Resistance: 2705 (R1), 2745 (R2), 2790 (R3).
Gold’s price appears to be moving in a downwards fashion. We opt for a bearish outlook for the precious metal’s price and supporting our case is the RSI indicator below our chart which currently registers a figure near 40, implying a bearish market sentiment. For our bearish outlook to continue, we would require a clear break below the 2640 (S1) support level, with the next possible target for the bears being the 2585 (S2) support line. On the flip side, for a sideways bias, we would require the precious metal’s price to remain confined between the 2640 (S1) support level and the 2705 (R1) resistance line. Lastly, for a bullish outlook we would require a clear break above the 2705 (R1) resistance line with the next possible target for the bulls being the 2745 (R2) resistance level.
Author

Phaedros Pantelides
IronFX
Mr Pantelides has graduated from the University of Reading with a degree in BSc Business Economics, where he discovered his passion for trading and analyzing global geopolitics.


