EUR/USD Testing Key 1.1150 Resistance for Bounce or Break

The EUR/USD is testing the crucial Fibonacci retracement levels of wave 4 vs 3 (orange) for a bullish breakout or bearish bounce.
4 hour chart
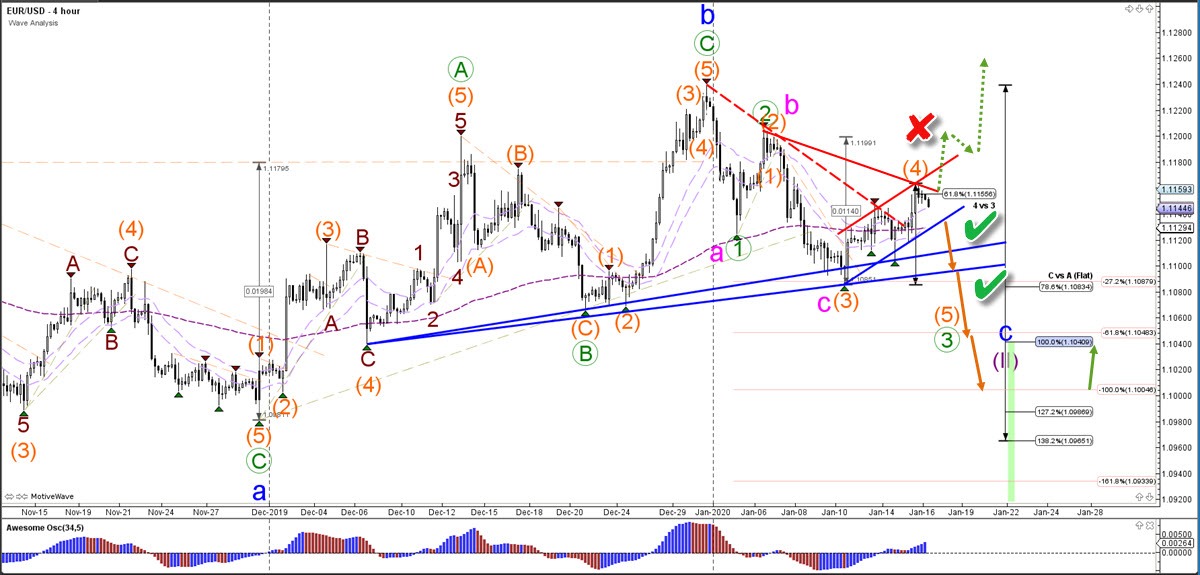
The EUR/USD bearish bounce at the resistance zone and breakout below the support lines (blue) could confirm (green check) the bearish wave outlook. The main target is the 1.10 round support zone. A bullish breakout, however, above 1.1150 invalidates (red x) the bearish 5 wave (orange) pattern and indicates a bullish price swing (dotted green lines).
1 hour chart
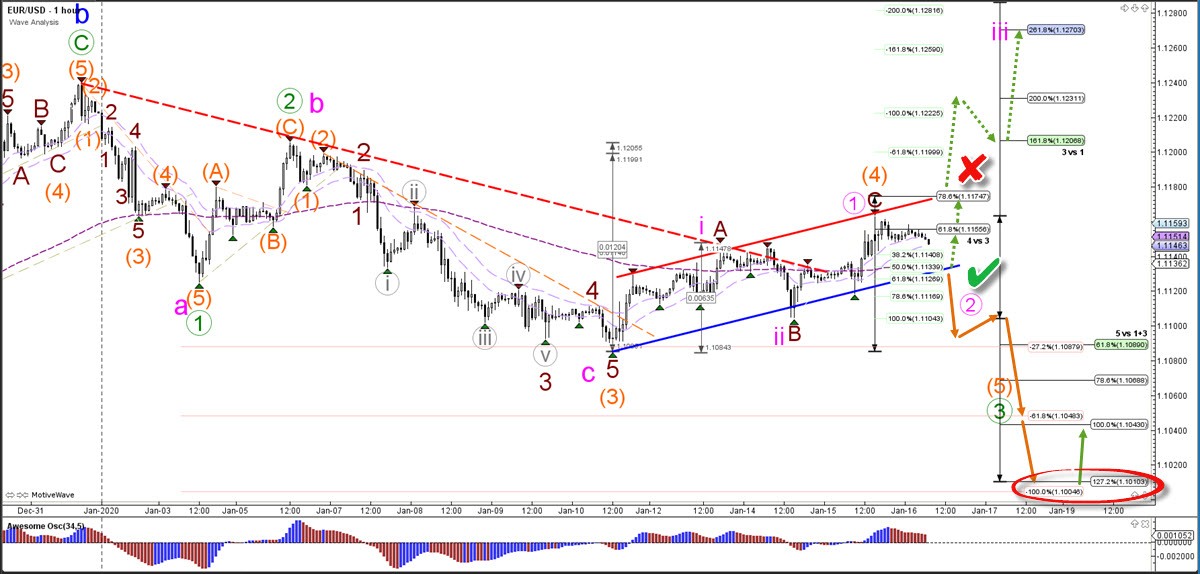
The EUR/USD is testing the Fibonacci support levels of the alternative wave outlook, which is indicated by the pink letters and numbers. A bullish bounce at the bottom (blue) of the channel and Fib levels and breakout above the resistance (red) of the channel could invalidate (red x) the bearish wave outlook and confirm a bullish variation. A bullish break is aiming at 1.12 and 1.1250 whereas a bearish breakout aims at 1.10.
The analysis has been done with the CAMMACD.Core System.
For more daily technical and wave analysis and updates, sign-up up to our ecs.LIVE channel.
Author

Chris Svorcik
Elite CurrenSea
Experience Chris Svorcik has co-founded Elite CurrenSea in 2014 together with Nenad Kerkez, aka Tarantula FX. Chris is a technical analyst, wave analyst, trader, writer, educator, webinar speaker, and seminar speaker of the financial markets.


