Technical analysis – Will EUR/USD quotes fall?
EUR/USD technical analysis summary
Below 1.048.
Sell Stop.
Above 1.076.
Stop Loss.
| Indicator | Signal |
| RSI | Sell |
| MACD | Sell |
| MA(200) | Neutral |
| Fractals | Sell |
| Parabolic SAR | Sell |
| Bollinger Bands | Neutral |
EUR/USD chart analysis
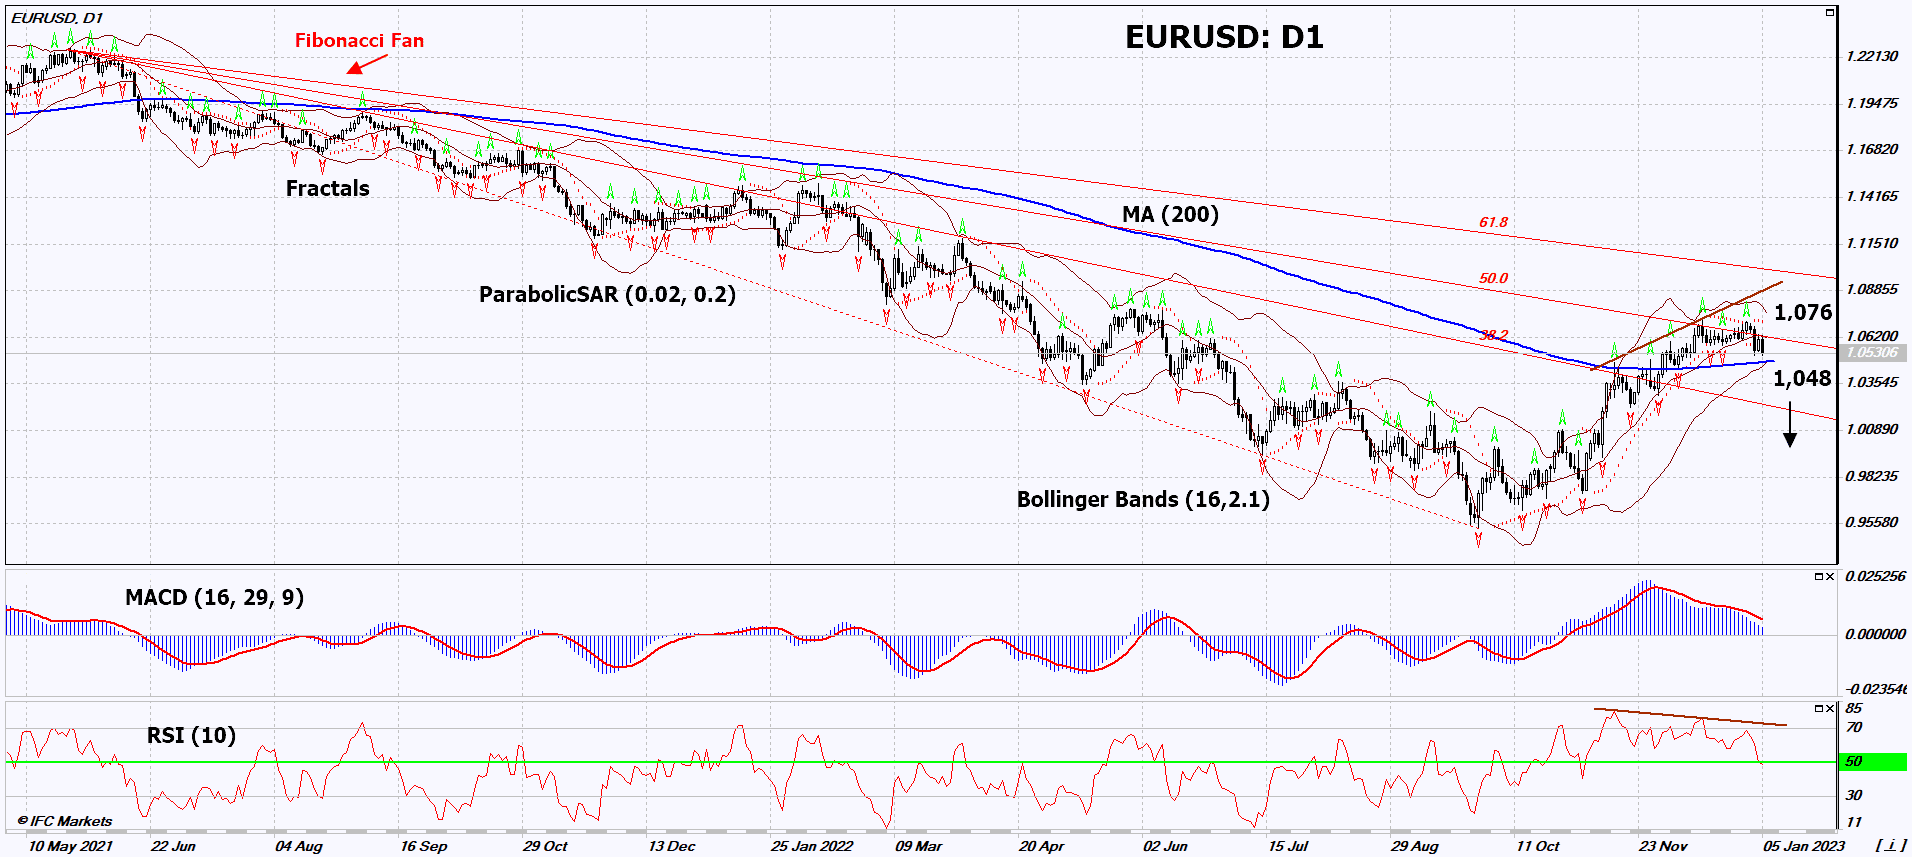
On the daily timeframe, EURUSD: D1 is in a long-term downtrend but has been correcting up lately. Before opening a position, the 200-day moving average line must be broken down. A number of technical analysis indicators have formed downward signals. We do not rule out a bearish movement if EURUSD: D1 falls below the 200-day moving average and lower Bollinger band: 1.048. This level can be used as an entry point. Initial risk cap is possible above the last 3 upper fractals, the upper Bollinger band, and the Parabolic signal: 1.076. After opening a pending order, we move the stop following the Bollinger and Parabolic signals to the next fractal low. Thus, we change the potential profit/loss ratio in our favor. The most cautious traders, after making a trade, can switch to a four-hour chart and set a stop loss, moving it in the direction of movement. If the price overcomes the stop level (1.076) without activating the order (1.048), it is recommended to delete the order: there are internal changes in the market that were not taken into account.
Fundamental analysis of forex - EUR/USD
In the US, good data on the labor market came out from the independent agency ADP. Will EURUSD quotes fall?
United States ADP Nonfarm Employment Change (Nonfarm Employment Change) in December 2022 increased to 235 thousand compared to 127 thousand in November. This is much better than the forecast. Now investors expect the same positive publication of official data on the labor market (United States Nonfarm Payrolls) on January 6. On the same day, the European Union Consumer Price Index will be released. Inflation in the EU is forecast to remain high at 10.5% y/y. This could be a negative factor for the euro.
Want to get more free analytics? Open Demo Account now to get daily news and analytical materials.
Want to get more free analytics? Open Demo Account now to get daily news and analytical materials.
Author

Dmitry Lukashov
IFC Markets
Dimtry Lukashov is the senior analyst of IFC Markets. He started his professional career in the financial market as a trader interested in stocks and obligations.


