EUR/USD: Long at 1.1950, target 1.2250

EUR/USD: Investors shrugged off weaker U.S. retail sales and industrial output data
Macroeconomic overview: U.S. retail sales unexpectedly fell in August and industrial output recorded its biggest drop since 2009 as Hurricane Harvey disrupted activity, suggesting the storm could dent economic growth in the third quarter.
Harvey, which lashed Texas in the last week of August, also has impacted the labor market. Hurricane Irma, which struck Florida last weekend, also is likely to hurt the economy, though analysts expect a rebound in the fourth quarter.
The Commerce Department said retail sales dropped 0.2% last month, the biggest decline in six months as motor vehicle sales tumbled 1.6%. Sales of building materials, electronics and appliances as well as clothing also fell. While noting that it could not isolate the impact of Harvey on retail sales, the department said it received indications from companies that the hurricane had "both positive and negative effects on their sales data while others indicated they were not impacted at all." Though Harvey likely depressed retail sales last month, data for July and June were revised down, suggesting a moderation in consumer spending after brisk growth in the second quarter.
The market had forecast retail sales nudging up 0.1% in August. While last month's drop in motor vehicle sales was the largest in seven months, the replacement of flood-damaged vehicles, especially in the Houston area, is expected to deliver a boost.
Overall retail sales increased 3.2% in August on a year-on-year basis. Excluding automobiles, gasoline, building materials and food services, retail sales fell 0.2% last month after an unrevised 0.6% increase in July.
These so-called core retail sales correspond most closely with the consumer spending component of gross domestic product. Consumer spending, which accounts for more than two-thirds of U.S. economic activity, increased at a 3.3% annualized rate in the second quarter. That boosted GDP growth to a 3.0% rate in the April-June period.
In a separate report on Friday, the Federal Reserve said industrial production declined 0.9% in August. That was the biggest drop since May 2009 and followed six straight monthly gains. The Fed attributed about 0.75 percentage point of the decline to storm effects that "temporarily curtailed drilling, servicing, and extraction activity for oil and natural gas." We expect industrial output to decline further in September, with Irma likely weighing on utilities.
Other data from the New York Fed on Friday showed its index of factory activity in New York state remained at lofty levels in September amid strong orders growth, indicating that manufacturing remains on solid ground apart from the storm-related distortions.
The weak retail sales and industrial output reports prompted the Atlanta Fed to slash its third-quarter GDP estimate to a 2.2% rate from a 3.0% pace.
The data, however, did little to change expectations that the Fed will announce a plan to start shrinking its USD 4.2 trillion portfolio of Treasury bonds and mortgage-backed securities at its September 19-20 policy meeting. The U.S. central bank is expected to raise interest rates again only in December.
Despite sluggish wage growth, even as the labor market nears full employment, the fundamentals for consumer spending are solid. In addition to the strong stock market, house prices have continued to rise.
Technical analysis: Investors shrugged off weaker U.S. macroeconomic data on Friday and the USD trimmed losses during U.S. session. Long upper shadow on Friday's candlestick may be worrying for the EUR/USD bulls. On the other hand, the pair remains still above short-term moving averages, which keeps bullish structure intact.
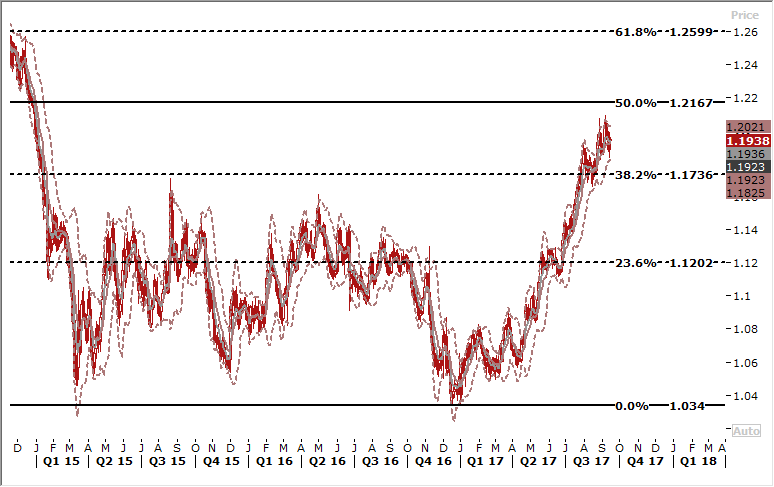
Short-term signal: Long for 1.2250
Long-term outlook: Bullish
USD/CAD: Loonie fell slightly as another BoC hike has been nearly fully discounted
Macroeconomic overview: The Canadian dollar lost ground on Friday against a weaker U.S. dollar, as the boost from last week's interest rate hike by the Bank of Canada showed some signs of fading.
Data from the overnight index swaps market showed that another hike has been nearly fully discounted by December.
Speculators have mostly held onto bullish bets on the loonie, data from the U.S. Commodity Futures Trading Commission showed. Canadian dollar net long positions dipped to 50,499 contracts as of September 12 from 53,644 contracts a week earlier. The bullish positioning indicates that investors have bought into the Bank of Canada's hawkish message.
Canadian household debt as a share of income hit a record in the second quarter as consumers spent more on durable goods, pointing to the challenges that could lie ahead for the economy as interest rates rise. The ratio of debt to disposable income rose to 167.8% from a downwardly revised 166.6% in the first quarter, Statistics Canada said on Friday. The Bank of Canada has been concerned that highly indebted Canadians have less flexibility to deal with sudden changes in their income.
Separate data showed Canadian home resales bounced back in August after four straight monthly declines, suggesting the cooling market may be stabilizing.
Technical analysis: The volatility of the USD/CAD has lowered in recent days. The pair remains below 7-day exponential moving average. The bears target is 1.1920 low on May 14, 2015.
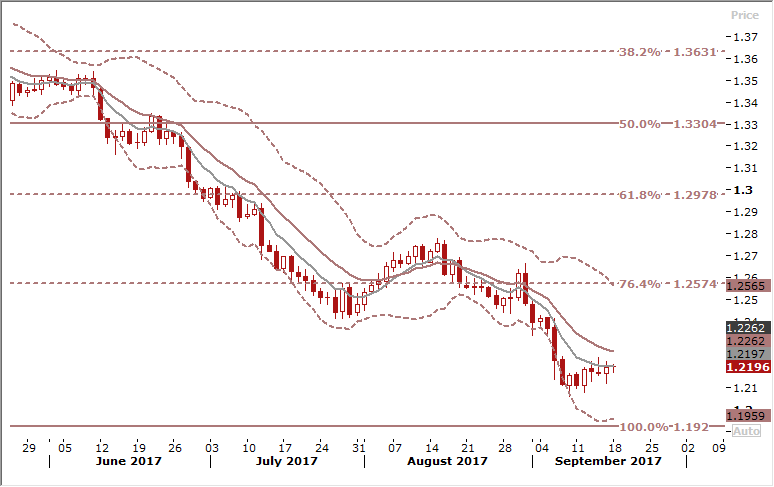
Short-term signal: Stay short for 1.1930
Long-term outlook: Bearish
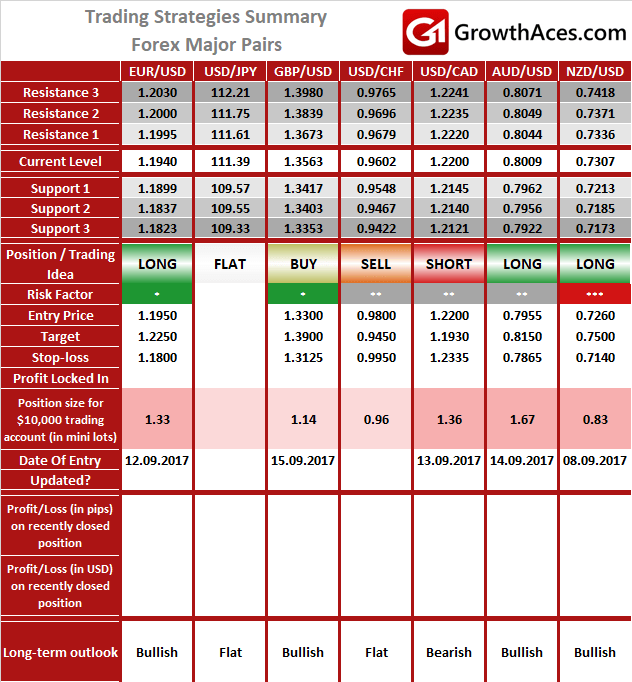
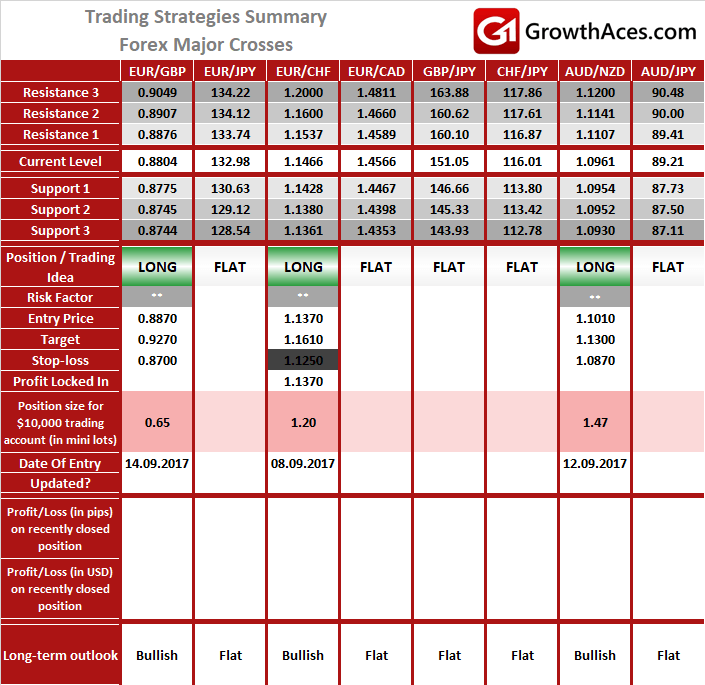
TRADING STRATEGIES SUMMARY:
FOREX - MAJOR PAIRS:
FOREX - MAJOR CROSSES:
PRECIOUS METALS:
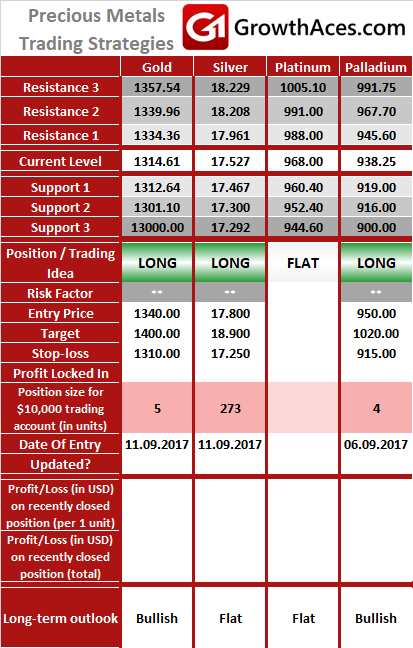
How to read these tables?
1. Support/Resistance - three closest important support/resistance levels
2. Position/Trading Idea: BUY/SELL - It means we are looking to open LONG/SHORT position at the Entry Price. If the order is filled we will set the suggested Target and Stop-loss level. LONG/SHORT - It means we have already taken this position at the Entry Price and expect the rate to go up/down to the Target level.
3. Stop-Loss/Profit Locked In - Sometimes we move the stop-loss level above (in case of LONG) or below (in case of SHORT) the Entry price. This means that we have locked in profit on this position.
4. Risk Factor - green "*" means high level of confidence (low level of uncertainty), grey "**" means medium level of confidence, red "***" means low level of confidence (high level of uncertainty)
5. Position Size (forex) - position size suggested for a USD 10,000 trading account in mini lots. You can calculate your position size as follows: (your account size in USD/USD 10,000) * (our position size). You should always round the result down. For example, if the result was 2.671, your position size should be 2 mini lots. This would be a great tool for your risk management!
Position size (precious metals) - position size suggested for a USD 10,000 trading account in units. You can calculate your position size as follows: (your account size in USD/USD 10,000) * (our position size).
6. Profit/Loss on recently closed position (forex) - is the amount of pips we have earned/lost on recently closed position. The amount in USD is calculated on the assumption of suggested position size for USD 10,000 trading account.
Profit/Loss on recently closed position (precious metals) - is profit/loss we have earned/lost per unit on recently closed position. The amount in USD is calculated on the assumption of suggested position size for USD 10,000 trading account.
Author

Growth Aces Research Team
Growth Aces
GrowthAces.com is an independent macroeconomic consultancy. They offer you daily forex analysis with forex signals for traders.


