|

EUR/USD holding tight to the edge of the cliff — Confluence Detector

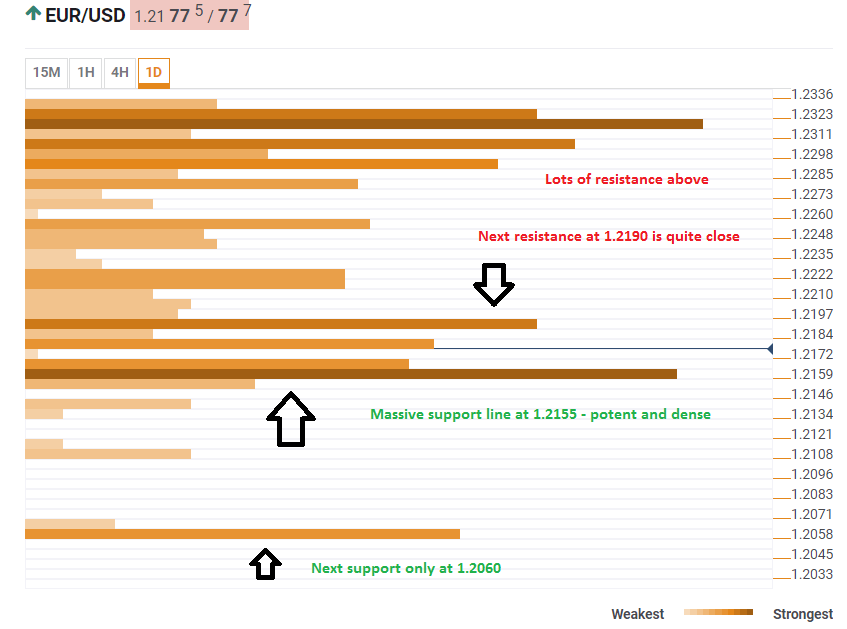
The Technical Confluences Indicator shows that the EUR/USD is trading above a dense and potent cluster of support lines. If it falls over, it could turn into an avalanche. The $1.2155 line is the convergence of the Pivot Point one-week Support 2, the PP one-month S1, the Bolinger Band 1-hour Lower (Stdv. 2.2), the 1d-high and the 4h-high.

Should it fall, the next significant cushion is only at $1.2060. This is the meeting point of the Pivot Point one-day S3 and the PP one-week S3

On the topside, the EUR/USD faces massive resistance. $1.2190 is the confluence of the BB one-day Lower, the Fibonacci 38.2% one-day, the Bolinger Band one-hour-Upper, the BB 15-Upper, and the Simple Moving Average 100-15m. 

The road to the upside is packed with many substantial lines of resistance which would limit any upside move of the pair.

All in all, the EUR/USD is currently confined to a narrow range. Should have the momentum to make a move, a break to the downside would allow for more significant falls.

Here is how it looks on the tool:

EURUSD Confluence April 26 2018 technical chart

Confluence Detector

The Confluence Detector finds exciting opportunities using Technical Confluences. The TC is a tool to locate and point out those price levels where there is a congestion of indicators, moving averages, Fibonacci levels, Pivot Points, etc. Knowing where these congestion points are located is very useful for the trader, and can be used as a basis for different strategies.

This tool assigns a certain amount of “weight” to each indicator, and this “weight” can influence adjacents price levels. This means that one price level without any indicator or moving average but under the influence of two “strongly weighted” levels accumulate more resistance than their neighbors. In these cases, the tool signals resistance in apparently empty areas.

Learn more about Technical Confluence

Author

Yohay Elam

Yohay Elam

FXStreet

Yohay is in Forex since 2008 when he founded Forex Crunch, a blog crafted in his free time that turned into a fully-fledged currency website later sold to Finixio.

More from Yohay Elam
Share:

Editor's Picks

AUD/USD consolidates above 0.7000/two-month low; bearish potential intact

The AUD/USD pair oscillates in a narrow range during the Asian session, and moves little following the release of mixed inflation figures from China. Spot prices currently trade around the 0.7025 region, nearly unchanged for the day, and remain within striking distance of a nearly two-month low set on Tuesday. Renewed hostilities between the US and Iran temper hopes for a deal to end the over three-month-old war.

Japanese Yen languishes despite wholesale inflation accelerates in May

USD/JPY flatlines after experiencing volatility, trading around 160.40 during the Asian hours on Wednesday. The pair continues to hold its ground, reflecting a struggling Japanese Yen that has failed to find support despite a massive acceleration in wholesale inflation. Driven by surging energy costs linked to the ongoing Middle East conflict, Japan’s Producer Price Index jumped 6.3% year-over-year in May. This hot printing comfortably outpaced April’s upwardly revised 5.3% figure and surpassed market consensus of 5.5%, marking the fastest pace of wholesale price growth in three years.

$4,200: Gold retains bearish bias near March low ahead of US CPI

Gold recovers slightly after touching a fresh low since March 23, though it retains a bearish bias near the $4,200 mark through the early European session. Renewed hostilities between the US and Iran fuel inflationary concerns and bolster bets for more hawkish central banks, which is seen as a key factor driving flows away from the non-yielding yellow metal. Furthermore, the decline could be attributed to technical selling following the recent breakdown below the very important 200-day SMA.

Cardano's downtrend deepens despite on-chain bottoming signals

Cardano edges lower to $0.1600 signaling a potential extension of the 30% loss from last week. The altcoin remains under intense selling pressure, weighing on its retail support. Still, a spike in dormant supply re-entering circulation signals that the selling pressure has run its course, a pattern that often precedes a rebound.

US CPI data set to show inflation at three-year high in May, backing Fed hawkish tilt

The US Bureau of Labor Statistics will publish the May Consumer Price Index (CPI) data on Wednesday. The report is expected to show another step up in consumer inflation, driven by the persistently high Oil prices due to the ongoing crisis in the Middle East.

The US economy defies the rules: 100 days into the Oil shock and the recession signal is still missing

More than three months after the start of the Iran war and the resulting disruption to global energy markets, the US economy continues to display remarkable resilience. The conflict has triggered a sharp rise in Oil prices, reignited inflationary pressures and fueled widespread concerns about a potential economic slowdown.