Looking at the charts: EUR/USD, GBP/USD, XAU/USD, USD/JPY

EUR/USD daily chart
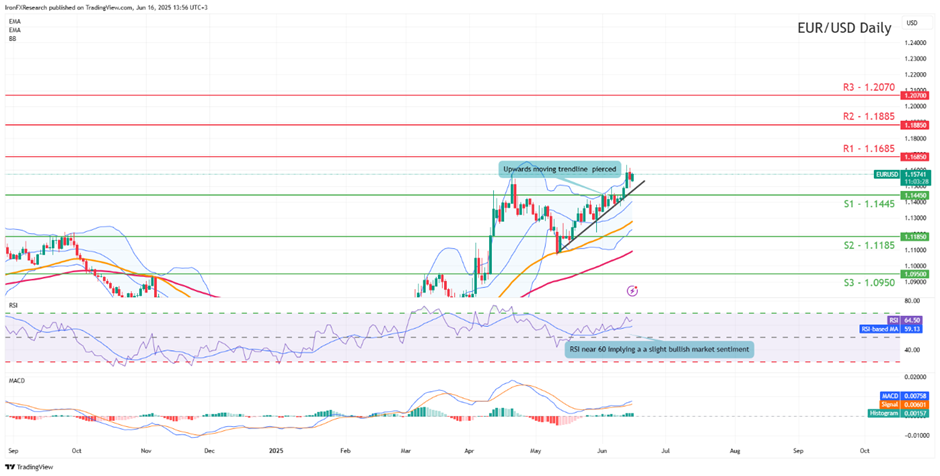
Support: 1.1445 (S1), 1.1185 (S2), 1.0950 (S3)
Resistance: 1.1685 (R1), 1.1885 (R2), 1.2070(R3)
EUR/USD appears to be moving in an upwards fashion, with the next possible target for the bulls being the 1.1685 (R1) resistance line. We opt for a bullish outlook for the pair and supporting our case is the RSI indicator below our chart which currently registers a figure above 60, implying a bullish market sentiment in addition to the pair having cleared our resistance now turned to support at the 1.1445 (S1) level. For our bullish outlook to continue we would require a clear break above the 1.1685 (R1) resistance line with the next possible target for the bulls being the 1.1885 (R2) resistance level. On the flip side for a sideways bias we would require the pair to remain confined between the 1.1445 (S1) support level and the 1.1685 (R1) resistance line. Lastly, for a bearish outlook we would require a clear break below the 1.1445 (S1) support level with the next possible target for the bears being the 1.1.1185 (S2) support line. Lastly, Euro traders may be also interested in the Fed’s interest rate decision which is set to occur this week. In particular, the majority of market participants are currently anticipating the bank to remain on hold, with FFF currently implying a 98.8% probability for such a scenario to materialize. Thus, depending on the narrative which emerges from the banks accompanying statement and Fed Chair Powell’s press conference, it could aid or weigh on the dollar and thus influence the EUR accordingly.
GBP/USD daily Chart
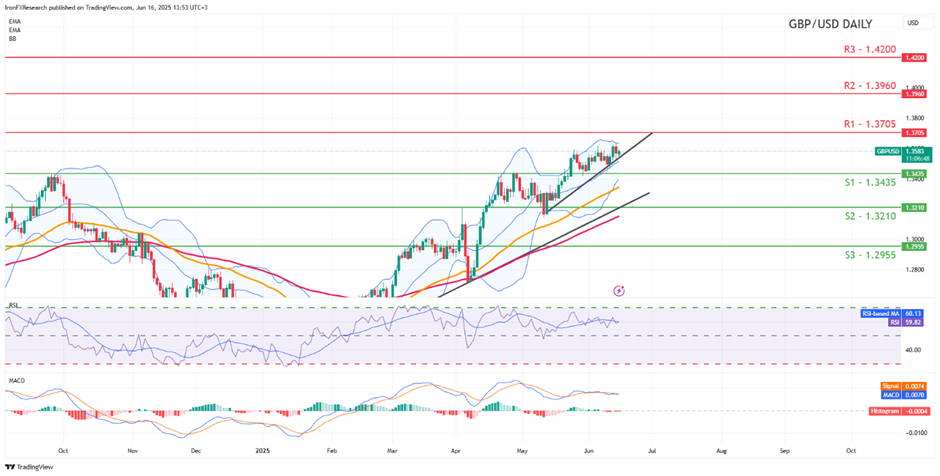
Support: 1.3435 (S1), 1.3210 (S2), 1.2955 (S3)
Resistance: 1.3705 (R1), 1.3960 (R2), 1.4200 (R3)
GBP/USD appears to be moving in an upwards fashion with the pair seemingly taking aim for our 1.3705 (R1) resistance level. We opt for a bullish outlook for the pair and supporting our case is the RSI indicator below our chart which currently registers a figure near 60, implying a bullish market sentiment. For our bullish outlook to continue we would require a clear break above the 1.3705 (R1) resistance line with the next possible target for the bulls being the 1.3960 (R2) resistance line. On the other hand, for a sideways bias we would require the pair to remain confined between the 1.3435 (S1) support level and the 1.3705 (R1) resistance line. Lastly, for a bearish outlook we would require a clear break below the 1.3435 (S1) support line with the next possible target for the bears being the 1.3210 (S2) support level. On a monetary level, cable traders may be interested in the release of the BoE’s interest rate decision this week, where the majority of market participants are currently anticipating the bank to remain on hold with GBP OIS implying a 91.6% probability for such a scenario. Therefore attention may turn to the banks accompanying statement, where we would not be surprised to see policymakers raising concerns over the global economic outlook, which could blur the banks interest rate path moving forward. Overall, should a bearish sentiment emerge from policymakers i.e implying that they may cut rates in the near future it could weigh on the pound and vice versa.
XAU/USD daily chart
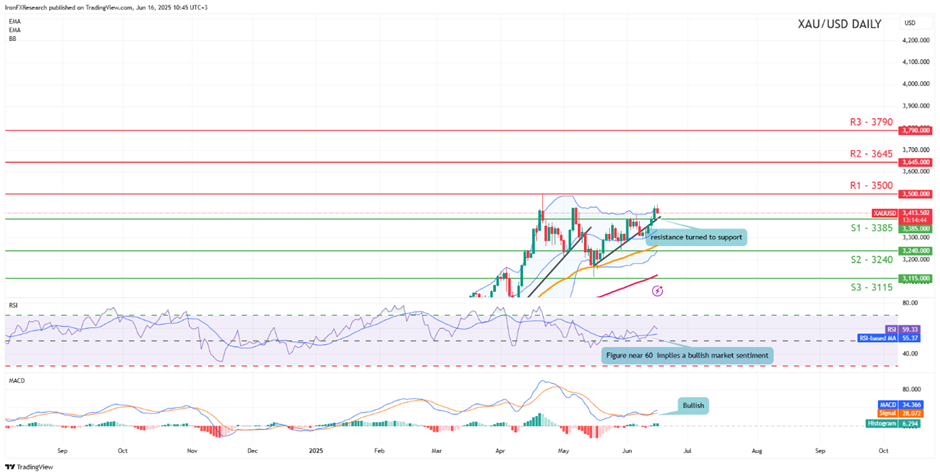
Support: 3385 (S1), 3240 (S2), 3115 (S3).
Resistance: 3500 (R1), 3645 (R2), 3790 (R3).
XAU/USD appears to be moving in an upwards fashion following the recent geopolitical developments between Israel and Iran which have been exchanging blows since last week and in particular over the weekend. However, we should note that the precious metal’s price appears to be retracing to lower ground since the opening of the markets today. Nonetheless, for our bullish outlook to be maintained we would require a break above the 3500 (R1) resistance line with the next possible target for the bulls being the possible 3645 (R2) resistance level. On the other hand, for a bearish outlook we would require a clear break below the 3385 (S1) support level with the next possible target for the bears being the 3240 (S2) support line. Lastly, for a sideways bias we would require gold’s price to remain confined between the 3385 (S1) support level and the 3500 (R1) resistance line.
USD/JPY daily chart
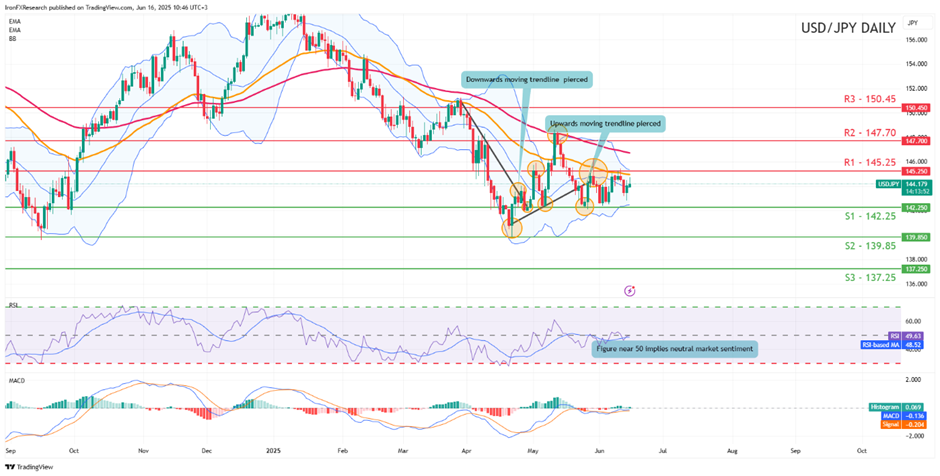
Support: 142.25 (S1), 139.85 (S2), 137.25 (S3)
Resistance: 145.25 (R1), 147.40 (R2), 150.45 (R3)
USD/JPY appears to be moving in a sideways fashion, with the pair failing to break below our 142.25 (S1) support level and also failing to clear our 145.25 (R1) resistance line. We opt for a sideways bias for the pair and supporting our case is the RSI indicator below our chart, which currently registers a figure near 50, implying a neutral market sentiment. For our sideways bias to be maintained, we would require the pair to remain confined between our 142.25 (S1) support level and the 145.25 (R1) resistance line. On the other hand, for a bearish outlook we would require a clear break below the 142.25 (S1) support level with the next possible target for the bears being the 139.85 (S2) support line. Lastly, for a bullish outlook, we would require a clear break above the 145.25 (R1) resistance line with the next possible target for the bulls being the 147.40 (R2) resistance level. On a monetary level, Yen traders may have their eyes set on their BOJ’s decision which is set to occur during tomorrow’s Asian session, with JPY OIS currently implying a 99.86% probability for the bank to remain on hold. Thus attention may also turn to the bank's accompanying statement.
Author

Phaedros Pantelides
Independent Analyst
Mr Pantelides has graduated from the University of Reading with a degree in BSc Business Economics, where he discovered his passion for trading and analyzing global geopolitics.


