EUR/USD Forecast: Sellers take over ahead of critical data-releases

EUR/USD Current Price: 1.0794
- Speculative interest awaits United States inflation and employment updates.
- US Treasury yields picked up as investors fear the Fed is not done yet.
- EUR/USD is set to extend its slide below the current August low at 1.0765.
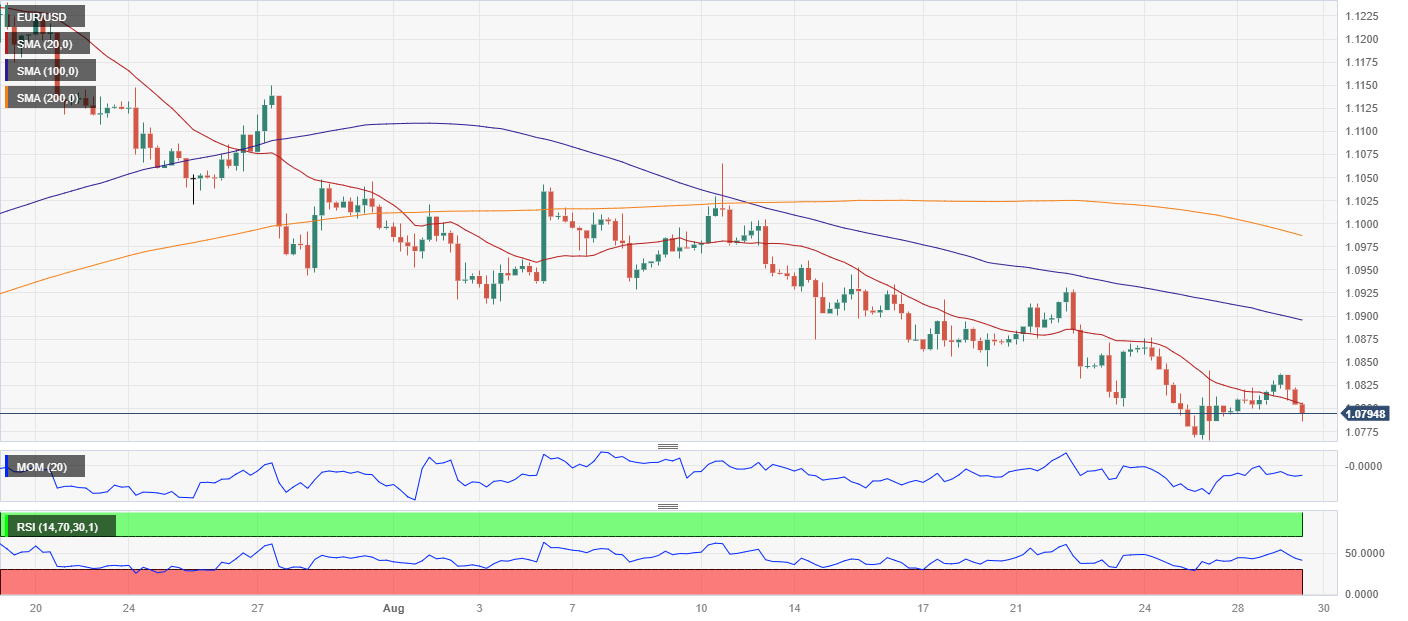
The EUR/USD pair spent the first half of the day lifeless, stuck around the 1.0800 threshold ahead of a slew of inflation and employment figures spread throughout the week. Generally speaking, the market sentiment remained tepid, with stock markets holding in the green but still heading into the monthly close with substantial losses.
The US Dollar gathers momentum ahead of Wall Street’s opening, and the first batch of relevant data as government bond yields tick north. The 10-year Treasury note currently offers 4.21%, while the 2-year note yields 5.01%, as investors await fresh clues about the future of monetary policy.
Data-wise, Germany published the September Gfk Consumer Confidence Survey, which resulted much worse than anticipated, sliding to -25.5 from the previous -24.6. The news limited demand for the Euro.
Speculative interest gears up for the United States (US) Job Openings and Labor Turnover Survey (JOLTS), as the labor market tightness could lift inflationary pressures and result in the Federal Reserve (Fed) choosing to remain on the monetary tightening path. The country will also publish the June Housing Price Index and August CB Consumer Confidence, the latter foreseen at 116.0 from 117.0 in the previous month.
EUR/USD short-term technical outlook
From a technical perspective, the daily chart for the EUR/USD supports another leg south. The pair currently trades at around 1.0790, sliding below a mildly bearish 200 Simple Moving Average (SMA). The shorter moving averages remain far above the longer ones, with the 20 SMA accelerating below the 100 SMA, usually a sign of increased selling interest. At the same time, technical indicators turned lower within negative levels, with the Relative Strength Index (RSI) indicator approaching oversold readings.
In the near term, and according to the 4-hour chart, the risk also skews to the downside. The Momentum indicator rotates south within neutral levels, while the RSI indicator accelerates lower at around 40. At the same time, the pair is back below a bearish 20 SMA after briefly trading above it. Bulls lack conviction, and lower lows are likely with a break below 1.0765, the August monthly low, at sight.
Support levels: 1.0765 1.0720 1.0685
Resistance levels: 1.0840 1.0885 1.0930
Author

Valeria Bednarik
FXStreet
Valeria Bednarik was born and lives in Buenos Aires, Argentina. Her passion for math and numbers pushed her into studying economics in her younger years.

















