EUR/USD Forecast: Risky to bet on a deep correction
- EUR/USD edged slightly lower after coming within a touching distance of 1.0900.
- The technical outlook points to overbought conditions for the pair.
- The US Dollar could have a hard time finding demand following Tuesday's inflation report.

EUR/USD advanced to its highest level since late August near 1.0900 on Tuesday as the US Dollar (USD) came under immense selling pressure following the October inflation data. Early Wednesday, the pair edged slightly lower but managed to stabilize above 1.0850.
Inflation in the US, as measured by the change in the Consumer Price Index (CPI), dropped to 3.2% in October from 3.7% in September, the US Bureau of Labor Statistics reported on Tuesday. On a monthly basis, the CPI held steady while the Core CPI, which excludes volatile food and energy prices, rose 0.2%.
Investors started to bet that the steady decline in inflation could cause the US Federal Reserve to reverse its policy in the second half of next year, forcing the 10-year US yield to fall sharply. As a result, Wall Street's main indexes rallied and the USD Index lost 1.5%.
September Industrial Production and Trade Balance will be featured in the European economic docket but these data are unlikely to trigger a market reaction. In the second half of the day, markets will pay close attention to October Retail Sales and Producer Price Index data from the US.
Unless there is a noticeable negative shift in risk mood, however, the USD could have a difficult time staying resilient against its rivals even if the data come in stronger than forecast.
EUR/USD Technical Analysis
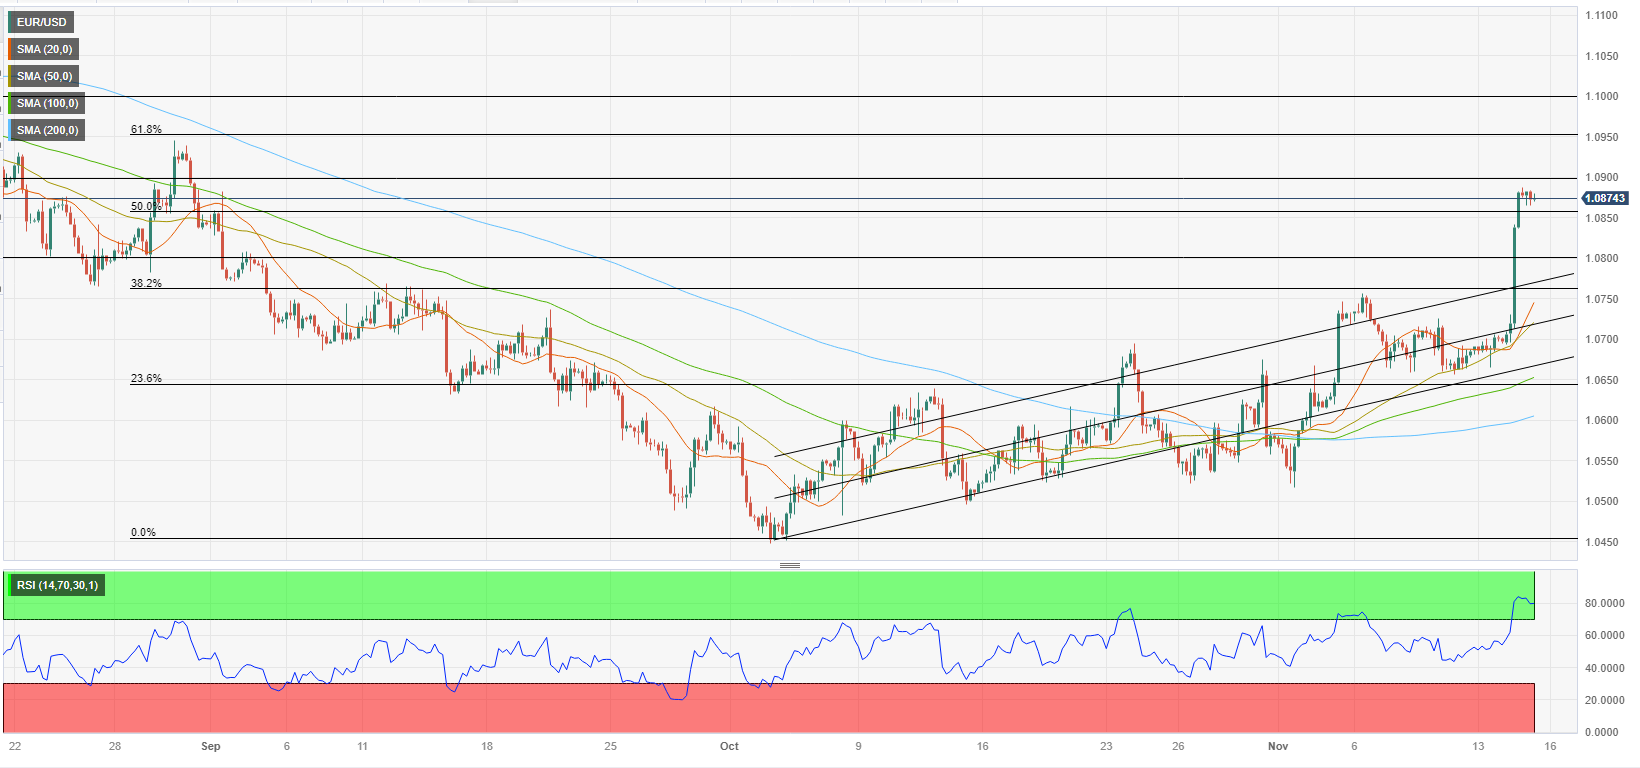
EUR/USD pierced through the upper limit of the ascending regression channel and the Relative Strength Index (RSI) indicator on the 4-hour chart rose above 80, highlighting extremely overbought conditions in the near term.
On the downside, 1.0850 (Fibonacci 50% retracement of the July-October downtrend) aligns as immediate support before 1.0800 (psychological level, static level) and 1.0750 (Fibonacci 38.2% retracement).
1.0900 (psychological level, static level) forms first resistance before 1.0950 (Fibonacci 61.8% retracement) and 1.1000 (psychological level, static level).
Author

Eren Sengezer
FXStreet
As an economist at heart, Eren Sengezer specializes in the assessment of the short-term and long-term impacts of macroeconomic data, central bank policies and political developments on financial assets.