EUR/USD Forecast: Near-term sellers increase the pressure

EUR/USD Current price: 1.0933
- The focus remains on the United States Consumer Price Index.
- Mixed European data undermines demand for the Euro.
- EUR/USD is bearish in the near term, support at 1.0920.
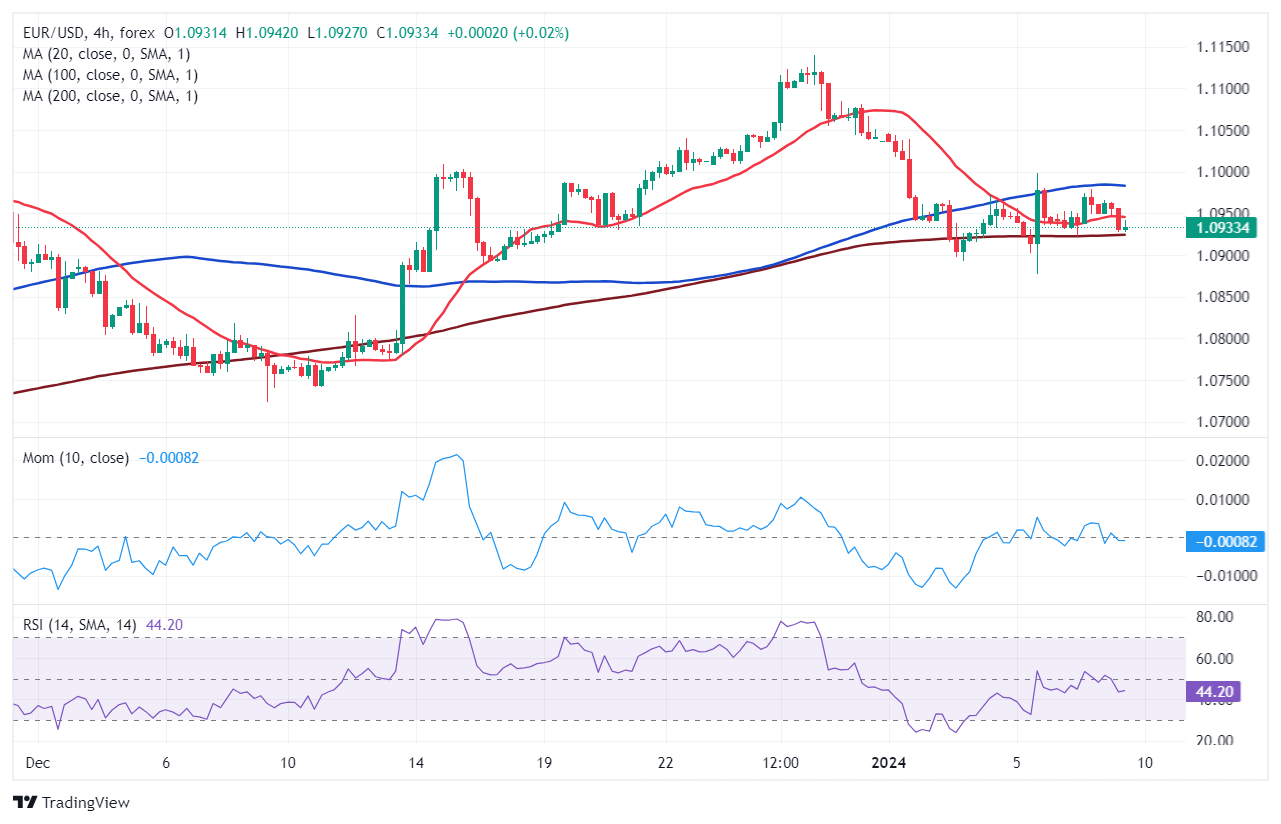
The EUR/USD pair trades with a soft tone on Tuesday, hovering around 1.0930. The pair trades within a well-limited range since the week started as market participants await fresh inflation data from the United States (US). The country will publish the December Consumer Price Index (CPI) next Thursday, foreseen at 3.2% YoY. Investors believe there is roughly a 60% chance the Federal Reserve (Fed) will proceed with a rate cut as soon as next March, despite the Fed repeatedly stating upcoming decisions will be data-dependant.
Meanwhile, the US Dollar benefits from firmer US Treasury yields. The 10-year note offers 4.04%, up 4 basis points (bps) ahead of the opening and not far from last week’s peak of 4.10%. At the time being, the 2-year note yields 4.38%. Stock markets, on the other hand, trade with a sour tone, with European indexes trading in the red and dragging US futures alongside.
Data-wise, European figures were mixed. On the one hand, German Industrial Production fell by 0.7% MoM in November, worse than anticipated. On the other hand, the Eurozone Unemployment Rate contracted to 6.4%. As for the US, the country released the NFIB Business Optimism Index, up in December to 91.9, better than anticipated. The country will later publish the November Goods and Services Trade Balance and January TIPP Economic Optimism.
EUR/USD short-term technical outlook
Technically, there has been no progress. The daily chart for EUR/USD offers a neutral-to-bearish stance, as the pair keeps meeting sellers around a bullish 20 Simple Moving Average (SMA) at around 1.0970, the immediate resistance area. At the same time, the longer moving averages remain lifeless far below the current level, while technical indicators turned lower within neutral levels, lacking enough strength to support a leg lower.
In the near term, however, the risk of a downward extension is higher. The 4-hour chart shows the pair is developing below its 20 and 100 SMAs while facing immediate support around a flat 200 SMA at 1.0920. Finally, the Momentum indicator hovers directionlessly around its midline, while the Relative Strength Index (RSI) indicator gains downward traction at 43, reflecting persistent selling interest.
Support levels: 1.0920 1.0885 1.0840
Resistance levels: 1.0970 1.1015 1.1060
Author

Valeria Bednarik
FXStreet
Valeria Bednarik was born and lives in Buenos Aires, Argentina. Her passion for math and numbers pushed her into studying economics in her younger years.