EUR/USD Forecast: Market players trying to recover the optimism

EUR/USD Current Price: 1.0970
- Demand for the US Dollar recedes ahead of Wall Street’s opening.
- European Central Bank President Christine Lagarde to hit the wires on Monday.
- EUR/USD trades below 1.1000 with limited bearish strength.
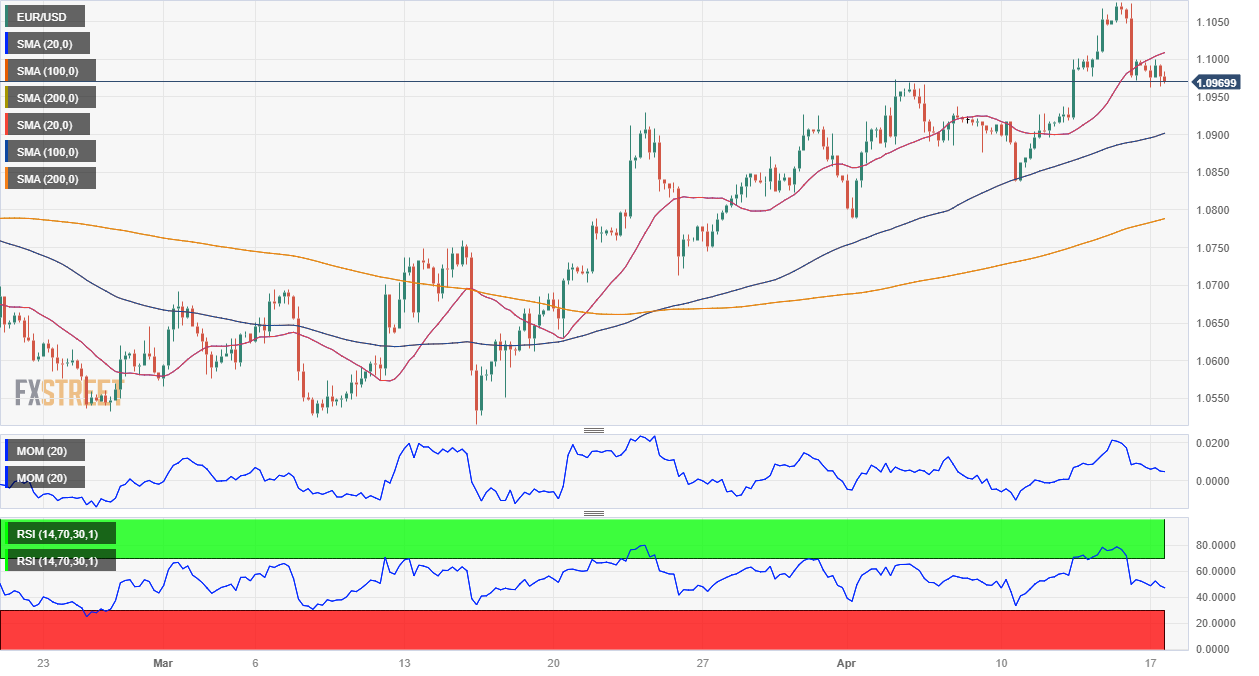
The EUR/USD pair lost the 1.1000 threshold on Friday and holds below the level this Monday, meeting sellers around the figure. The US Dollar spent most of the last week on the back foot, recovering in thelast trading session amid resurgent risk aversion.
Central banks gear up for May decisions
On the one hand, United States macroeconomic data missed expectations, fueling recession-related concerns. On the other hand, Federal Reserve (Fed) officials hit the wires with hawkish words. Governor Christopher Waller argued that the recent data show that the Fed hasn't made much progress on its inflation goal and added that rates need to rise further. Also, Bank of Chicago President Austan Goolsbee said that a mild recession in the US is definitely on the table.
Across the pond, European Central Bank (ECB) policymakers repeated ad exhaustion the central bank could opt for a 25 basis point ( bps) or a 50 bps move in May. On Monday, it was the turn of Martins Kazaks, Governor at the Bank of Latvia, to reiterate the message.
Data-wise, the macroeconomic calendar has little to offer today. ECB President Christine Lagarde will speak at the Council on Foreign Relations C. Peter McColough Series on International Economics and may comment on monetary policy. The United States published the NY Empire State Manufacturing Index, which improved in April to 10.8 from -24.6 in the previous month. The news fell short of boosting the market’s sentiment, although the US Dollar seems nowhere near accelerating its advance.
EUR/USD short-term technical outlook
The EUR/USD pair daily chart shows that it is posting modest losses with limited bearish potential. The pair continues to develop above firmly bullish moving averages, with the 20 Simple Moving Average (SMA) advancing above the longer ones and providing dynamic support at around 1.0890. Technical indicators, in the meantime, ease further from last Thursday's peaks but with moderate downward strength and are still well into positive territory.
In the near term, and according to the 4-hour chart, the pair offers a neutral stance. Technical indicators recovered from their intraday lows but lack bullish strength. The Relative Strength Index (RSI) indicator consolidates at around 47, while the Momentum indicator aims north below its 100 line. At the same time, a mildly bullish 20 SMA caps advances at around 1.1010, while the longer moving averages have partially lost their bullish strength far below the current level.
Support levels: 1.0935 1.0890 1.0850
Resistance levels: 1.1010 1.1060 1.1100
Author

Valeria Bednarik
FXStreet
Valeria Bednarik was born and lives in Buenos Aires, Argentina. Her passion for math and numbers pushed her into studying economics in her younger years.