EUR/USD Forecast: Hotter US CPI puts markets in panic mode

EUR/USD Current price: 1.0710
- The German ZEW survey showed the assessment of the current situation worsened further.
- The United States Consumer Price Index unexpectedly rose in January.
- EUR/USD approaches 1.0700 with a firm bearish momentum, could break lower.
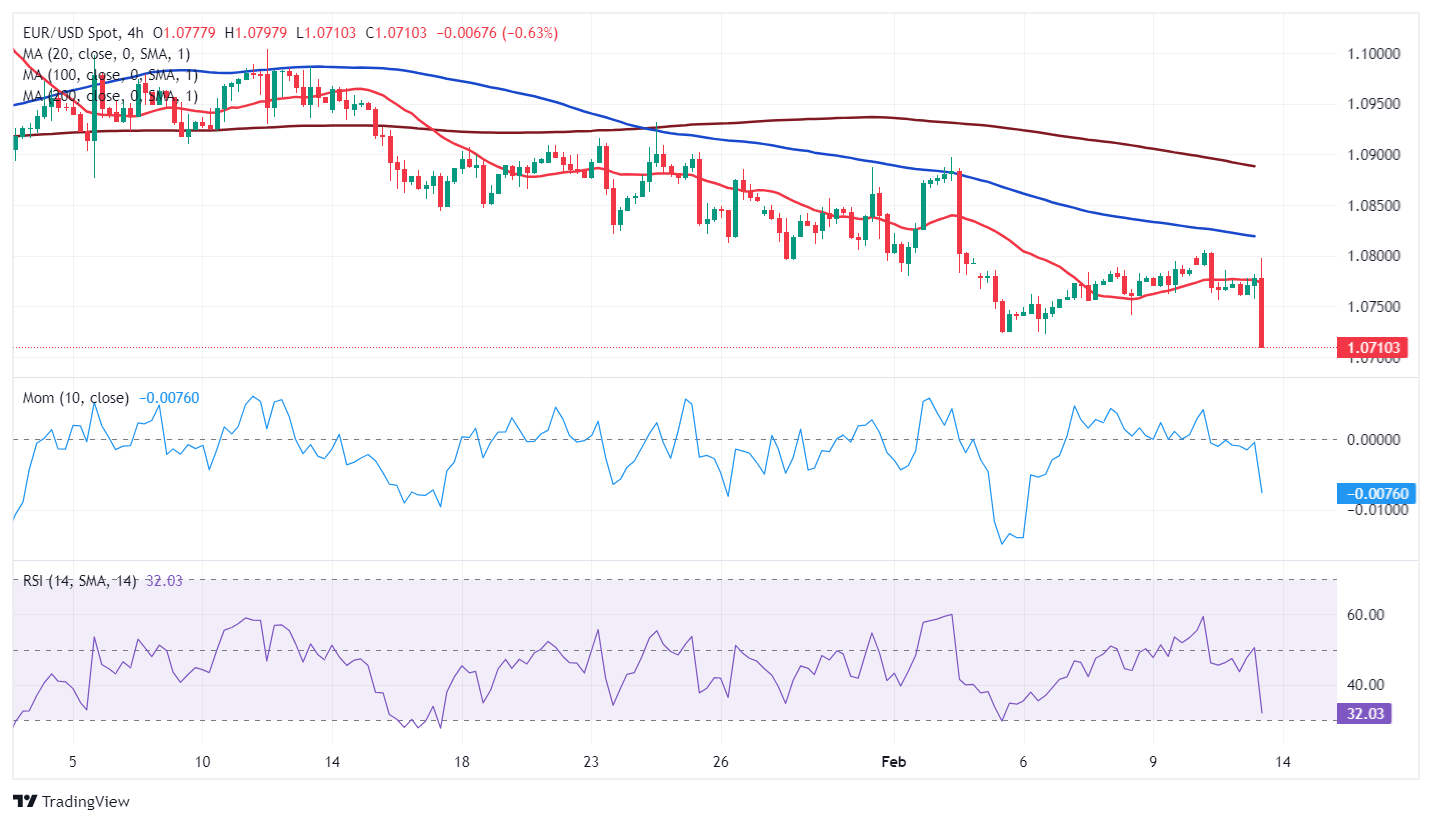
The EUR/USD pair spent the first half of the day trading uneventfully around the 1.0770 price zone, as the Euro could not take advantage of the broad US Dollar’s weakness. The upbeat performance of Asian equities following an extended weekend undermined demand for the Greenback. The tech sector kept leading the way north among equities, as the Nikkei 225 soared following news that Tokyo Electron increased its full-year revenue and profit guidance.
On the other hand, Euro gains were limited by local news. Financial markets turned more cautious in Europe following a disappointing German ZEW Survey and ahead of the release of an update of the United States (US) Consumer Price Index (CPI). Germany reported that the Economic Sentiment improved more than anticipated in February, up to 19.9 from 15.2 in the previous month. The Eurozone Economic Sentiment also improved, to 25 from 22.7 in January. However, the assessment of the current situation plummeted to -81.7, the lowest reading since June 2020. On a positive note, the survey showed respondents expect an imminent interest rate cut in the US and the European Central Bank (ECB) proceeding in the next six months.
Finally, the US reported that inflation in January was higher than anticipated, and hell broke loose. The monthly CPI rose 0.3%, while the core reading printed 0.4%. Compared to a year earlier, inflation rose 3.1%, better than the previous 3.4% but above the 2.9% expected. Finally, the core annual CPI rose 3.9%. The market turned risk averse, with stocks plummeting and the US Dollar soaring across the FX board, as higher inflation means no rate cut in the near future.
EUR/USD short-term technical outlook
The EUR/USD pair trades at fresh lows below 1.0720, and pullbacks post-release have been shallow, suggesting the slide may continue. The daily chart shows a directionless 100 Simple Moving Average (SMA) keeps limiting advances around 1.0790, while the 20 SMA keeps heading south above it. At the same time, technical indicators turned sharply lower within negative levels, although far above oversold readings.
In the near term, and according to the 4-hour chart, the bearish case is firm. The pair develops below bearish moving averages, with intraday spikes above the 20 SMA being quickly reverted. Finally, technical indicators head south almost vertically, reflecting a solid selling interest.
Support levels: 1.0695 1.0650 1.0610
Resistance levels: 1.0745 1.0790 1.0840
Author

Valeria Bednarik
FXStreet
Valeria Bednarik was born and lives in Buenos Aires, Argentina. Her passion for math and numbers pushed her into studying economics in her younger years.