EUR/USD Forecast: Extra losses remain well on the cards
- EUR/USD extends the negative start of the week below 1.0900.
- ECB officials pushed back rate cut expectations.
- Next on the downside comes the 200-day SMA.

EUR/USD added to the ongoing bearish move and dropped significantly on turnaround Tuesday, this time breaching the key support at 1.0900 the figure to clinch a new yearly bottom near 1.0860.
Indeed, the continuation of the move higher in the greenback pushed the USD Index (DXY) to new 2024 peaks past the 103.00 hurdle, helped by the equally firm bias in US yields, as US traders returned to their desks following the MLK holiday.
Contributing to the EUR’s subdued price action emerged comments from ECB officials, who, despite favouring rate cuts this year, their timing appeared largely in contrast with investors’ expectations. So far, market participants anticipate the central bank to trim its interest rates by around 120 bps in the current year.
Collaborating with the noticeable rebound in the dollar, CME Group’s FedWatch Tool now sees the probability of a rate cut by the Fed at around 70% in March vs. nearly 80% the day before.
The marked decline in spot also came against the backdrop of rising yields across the board, with German 10-year bunds at yearly highs of around 2.25% and US yields sharply up across different maturities.
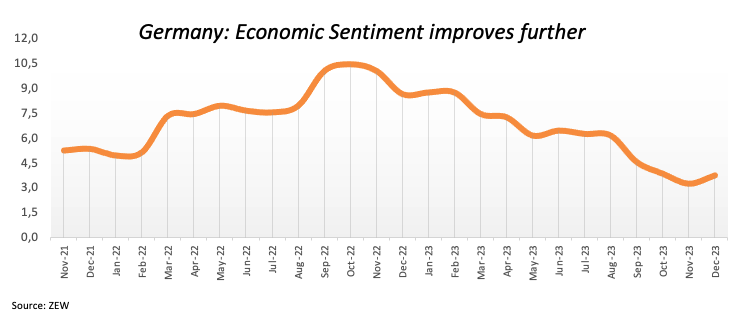
On another front, the improvement in the Economic Sentiment in both Germany (15.2) and the broader Euroland (22.7) for the current month did nothing to lend some support to the European currency. Across the pond, the NY Empire State Manufacturing Index weakened considerably to -43.7 also in January.
EUR/USD daily chart
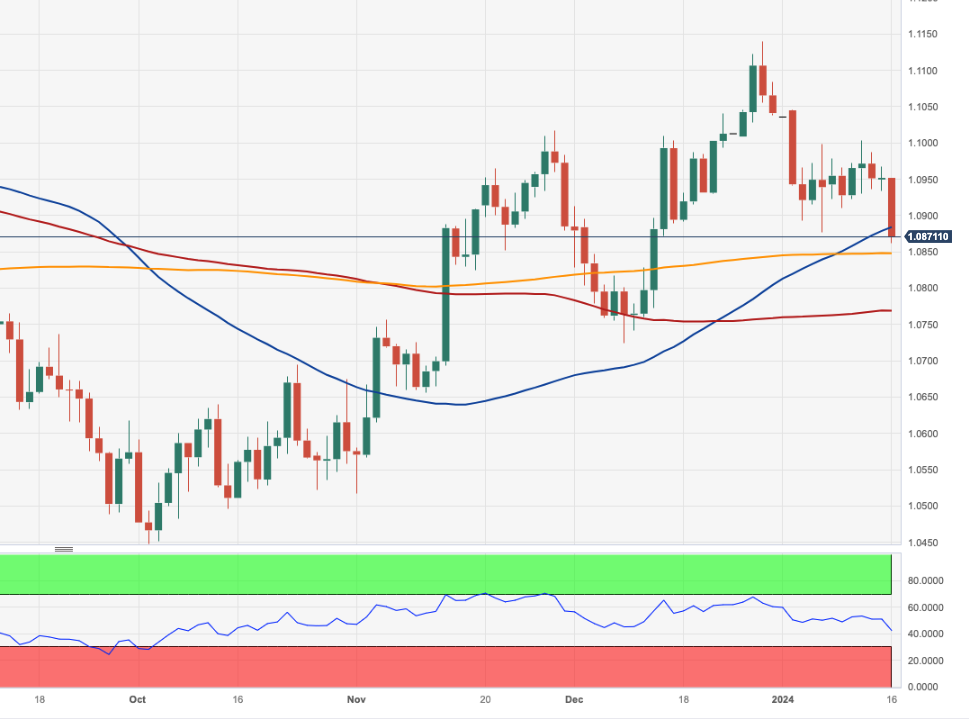
EUR/USD short-term technical outlook
If the EUR/USD falls further and breaches the 2024 low of 1.0861 (January 16), it might make touch with the critical 200-day SMA at 1.0847. If the latter is lost, the December 2023 low of 1.0723 (December 8) may reappear before the weekly low of 1.0495 (October 13, 2023), followed by the October 2023 low of 1.0448 (October 3) and the round level of 1.0400. The positive outlook for the pair is expected to be challenged below the 200-day SMA.
The 4-hour chart now favours extra losses in the very near term. The breakdown of 1.0861 should not see a support level of note until 1.0723. The MACD trades also in the negative zone, and this scenario appears reinforced by the RSI around 28, indicating oversold conditions. In the event of occasional bullish attempts, there is immediate resistance at the 200-SMA at 1.0925 ahead of 1.0998, which appears to be bolstered by the vicinity of the 100-SMA near 1.0980.
Premium
You have reached your limit of 3 free articles for this month.
Start your subscription and get access to all our original articles.
Author

Pablo Piovano
FXStreet
Born and bred in Argentina, Pablo has been carrying on with his passion for FX markets and trading since his first college years.


