• EUR/USD has turned south and declined below 1.0900.
  • The pair is likely to find support at 1.0840.
  • Mixed comments from ECB officials seem to be limiting the Euro's upside for the time being.

EUR/USD has lost its traction and declined below 1.0900 after having reached its highest level since April above 1.0900 earlier in the day. The pair's near-term technical outlook suggests that the pair's recent pullback is a technical correction rather than a reversal of direction.

The US Dollar started the new week under selling pressure and helped EUR/USD build on last week's gains during the Asian trading hours. With the benchmark 10-year US Treasury bond yield rising to the 3.5% area, however, the US Dollar managed to find demand and didn't allow the pair to preserve its bullish momentum. ,

On the other hand, mixed comments from European Central Bank (ECB) officials seem to have caused the Euro to lose some interest. ECB policymaker Peter Kazimir said on Monday that he is convinced that they need to deliver two more 50 basis points rate hikes. On a dovish note, "the adjustment of interest rates needs to be more gradual, taking into account the slowdown in growth of the euro area economy," Governing Council member Yannis Stournaras argued.

Meanwhile, US stock index futures edged higher after having stayed flat for the majority of the day and were last seen rising between 0.3% and 0.4%.

In case risk flows start to dominate the financial markets following Wall Street's opening bell, the US Dollar could have a difficult time holding its ground and open the door for a rebound in EUR/USD.

EUR/USD Technical Analysis

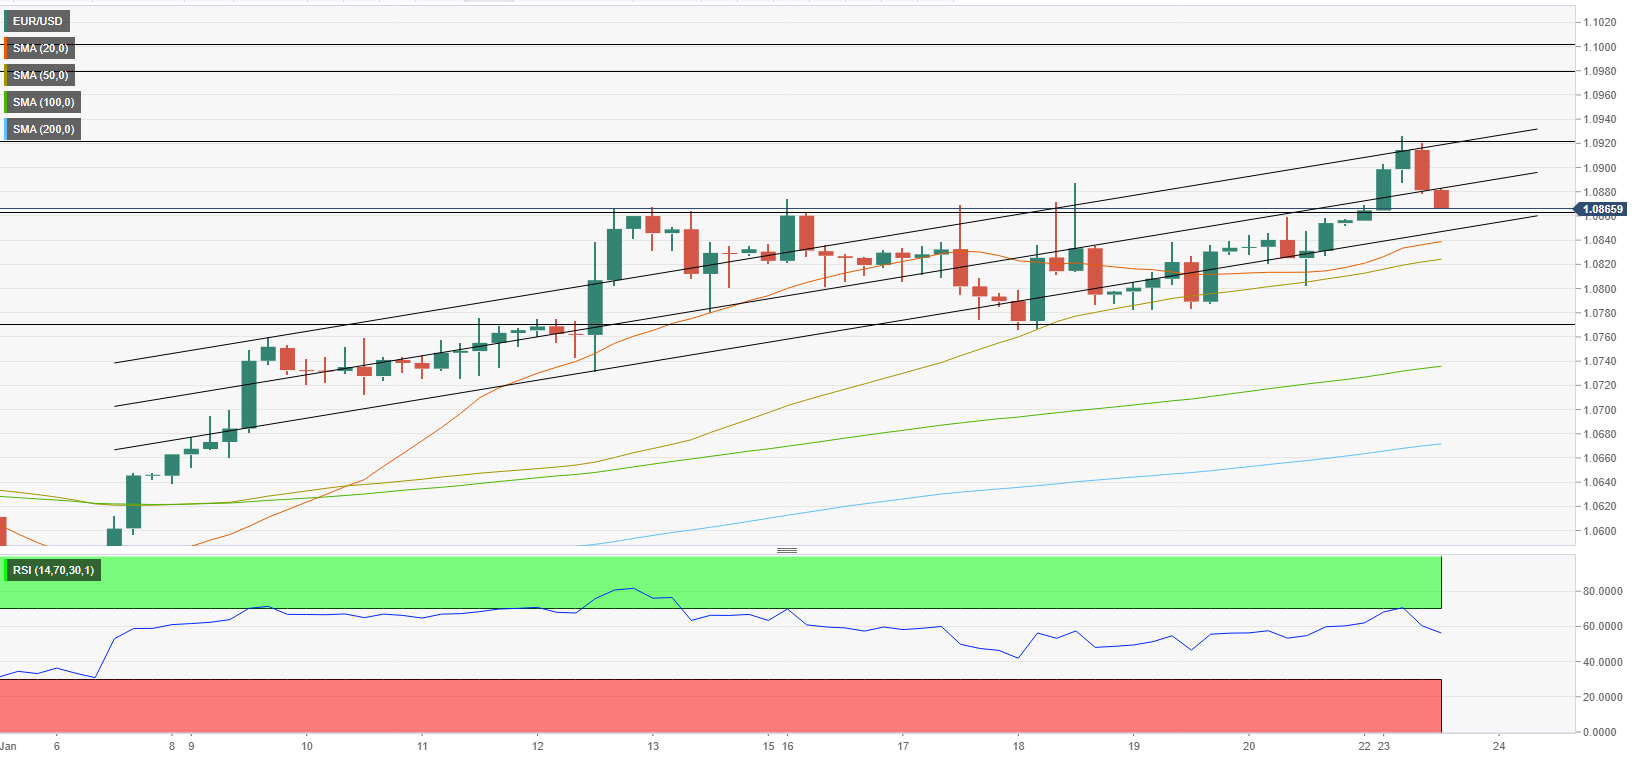
EUR/USD declined into the lower half of the ascending regression channel coming from early January. The Relative Strength Index (RSI) indicator on the four-hour chart stays comfortably above 50, suggesting that the latest pullback is part of a technical correction.

On the downside, 1.0860 (static level) aligns as interim support before 1.0840 (lower limit of the ascending channel). Only a four-hour close below the latter could be seen as a bearish development and trigger an extended slide toward 1.0820 (50-period Simple Moving Average (SMA)) and 1.0800 (psychological level).

First resistance is located at 1.0880 (mid-point of the ascending channel) ahead of 1.0900 (psychological level) and 1.0920 (upper-limit of the ascending channel).

Information on these pages contains forward-looking statements that involve risks and uncertainties. Markets and instruments profiled on this page are for informational purposes only and should not in any way come across as a recommendation to buy or sell in these assets. You should do your own thorough research before making any investment decisions. FXStreet does not in any way guarantee that this information is free from mistakes, errors, or material misstatements. It also does not guarantee that this information is of a timely nature. Investing in Open Markets involves a great deal of risk, including the loss of all or a portion of your investment, as well as emotional distress. All risks, losses and costs associated with investing, including total loss of principal, are your responsibility. The views and opinions expressed in this article are those of the authors and do not necessarily reflect the official policy or position of FXStreet nor its advertisers. The author will not be held responsible for information that is found at the end of links posted on this page.

If not otherwise explicitly mentioned in the body of the article, at the time of writing, the author has no position in any stock mentioned in this article and no business relationship with any company mentioned. The author has not received compensation for writing this article, other than from FXStreet.

FXStreet and the author do not provide personalized recommendations. The author makes no representations as to the accuracy, completeness, or suitability of this information. FXStreet and the author will not be liable for any errors, omissions or any losses, injuries or damages arising from this information and its display or use. Errors and omissions excepted.

The author and FXStreet are not registered investment advisors and nothing in this article is intended to be investment advice.

Recommended Content


Recommended Content

Editors’ Picks

EUR/USD regains traction, recovers above 1.0700

EUR/USD regains traction, recovers above 1.0700

EUR/USD regained its traction and turned positive on the day above 1.0700 in the American session. The US Dollar struggles to preserve its strength after the data from the US showed that the economy grew at a softer pace than expected in Q1.

EUR/USD News

GBP/USD returns to 1.2500 area in volatile session

GBP/USD returns to 1.2500 area in volatile session

GBP/USD reversed its direction and recovered to 1.2500 after falling to the 1.2450 area earlier in the day. Although markets remain risk-averse, the US Dollar struggles to find demand following the disappointing GDP data.

GBP/USD News

Gold climbs above $2,340 following earlier drop

Gold climbs above $2,340 following earlier drop

Gold fell below $2,320 in the early American session as US yields shot higher after the data showed a significant increase in the US GDP price deflator in Q1. With safe-haven flows dominating the markets, however, XAU/USD reversed its direction and rose above $2,340.

Gold News

XRP extends its decline, crypto experts comment on Ripple stablecoin and benefits for XRP Ledger

XRP extends its decline, crypto experts comment on Ripple stablecoin and benefits for XRP Ledger

Ripple extends decline to $0.52 on Thursday, wipes out weekly gains. Crypto expert asks Ripple CTO how the stablecoin will benefit the XRP Ledger and native token XRP. 

Read more

After the US close, it’s the Tokyo CPI

After the US close, it’s the Tokyo CPI

After the US close, it’s the Tokyo CPI, a reliable indicator of the national number and then the BoJ policy announcement. Tokyo CPI ex food and energy in Japan was a rise to 2.90% in March from 2.50%.

Read more

Majors

Cryptocurrencies

Signatures