EUR/USD Forecast: Euro closes in on key support area
- EUR/USD has continued to push lower early Monday.
- Sellers could show interest in case the pair drops below 1.0200.
- The dollar is likely to preserve its strength in case markets remain risk-averse.

EUR/USD has started the new week on a bearish note amid a souring market mood. The pair continues to push lower toward the significant support area that seems to have formed at 1.0200 and a drop below that level could attract sellers and open the door for an extended decline.
Markets remain risk-averse early Monday as US-China geopolitical tensions continue to escalate following US lawmakers' visit to Taiwan over the weekend. Moreover, disappointing Retail Sales and Industrial Production data releases from China reminded investors of the negative impact of the country's zero-Covid policy on economic activity.
Citing the findings of a recently conducted survey, Bloomberg reported on Monday that economists now expect the eurozone could enter a technical recession amid the deepening energy crisis and record-high inflation. "The probability of output shrinking for two straight quarters has risen to 60% from 45% in a previous survey, and up from 20% before Russia invaded Ukraine," Bloomberg explained.
In the second half of the day, the Federal Reserve Bank of New York will release the Empire State Manufacturing Survey. The NAHB Housing Market Index for August will also be looked upon for fresh impetus.
According to the CME Group FedWatch Tool, there is now a 46.5% probability of the Fed hiking the policy rate by 75 basis points in December and Monday's data releases are unlikely to impact the rate increase odds in a significant way. Hence, the risk perception could continue to drive the market action during the American trading hours. US stock index futures were down between 0.2% and 0.3% at the time of press, suggesting that the market mood is likely to remain cautious.
EUR/USD Technical Analysis
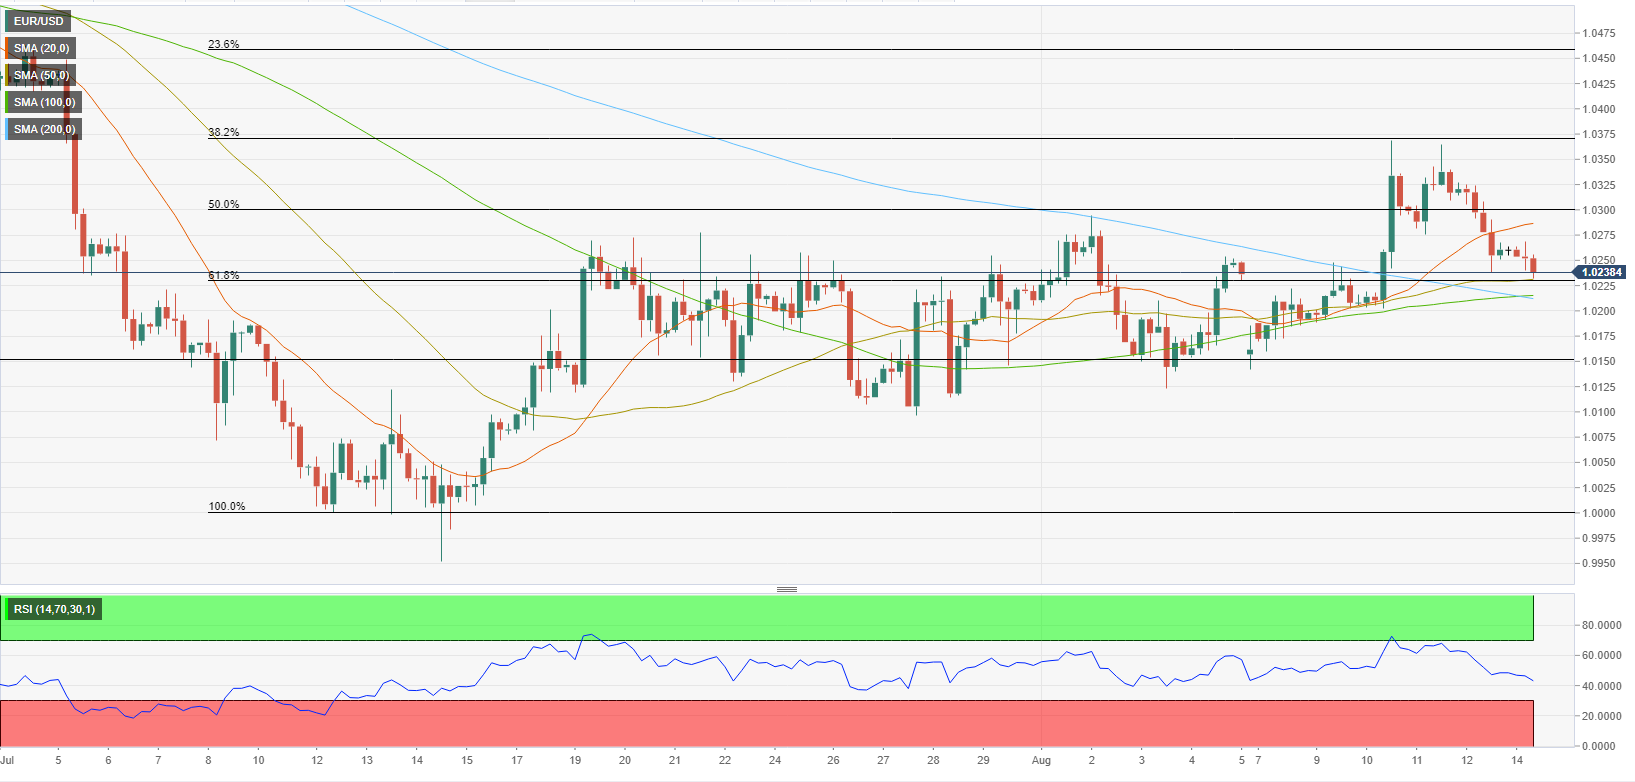
EUR/USD faces immediate support at 1.0230 (Fibonacci 38.2% retracement of the latest downtrend) ahead of 1.0200, where the 100-period and the 200-period SMAs on the four-hour chart are located. A four-hour close below the latter could be seen as a bearish development and attract sellers. In that scenario, the 1.0150 (static level) could be seen as the next target on the downside.
1.0300 (Fibonacci 50% retracement) aligns as strong resistance ahead of 1.0370 (Fibonacci 61.8% retracement) and 1.0400 (psychological level).
Meanwhile, the Relative Strength Index (RSI) indicator on the four-hour chart declines toward 40, pointing to a buildup in bearish momentum.
Premium
You have reached your limit of 3 free articles for this month.
Start your subscription and get access to all our original articles.
Author

Eren Sengezer
FXStreet
As an economist at heart, Eren Sengezer specializes in the assessment of the short-term and long-term impacts of macroeconomic data, central bank policies and political developments on financial assets.


