EUR/USD Forecast: Euro clears key resistance ahead of US inflation report
- EUR/USD climbed to a fresh multi-week high above 1.0800.
- The US Dollar could stay under pressure on a soft inflation report.
- The near-term technical outlook points to overbought conditions.


EUR/USD gathered bullish momentum in the early American session on Tuesday and climbed above 1.0800. The pair extended its uptrend and touched its highest level since April 10 on Wednesday. Although the near-term technical outlook points to overbought conditions for the pair, buyers could retain control in case inflation data from the US come in below expectations.
Euro PRICE This week
The table below shows the percentage change of Euro (EUR) against listed major currencies this week. Euro was the strongest against the Japanese Yen.
| USD | EUR | GBP | JPY | CAD | AUD | NZD | CHF | |
|---|---|---|---|---|---|---|---|---|
| USD | -0.54% | -0.58% | 0.22% | -0.25% | -0.61% | -0.62% | -0.15% | |
| EUR | 0.54% | -0.09% | 0.76% | 0.26% | -0.11% | -0.11% | 0.37% | |
| GBP | 0.58% | 0.09% | 0.77% | 0.35% | -0.02% | -0.02% | 0.46% | |
| JPY | -0.22% | -0.76% | -0.77% | -0.50% | -0.81% | -0.91% | -0.35% | |
| CAD | 0.25% | -0.26% | -0.35% | 0.50% | -0.34% | -0.39% | 0.02% | |
| AUD | 0.61% | 0.11% | 0.02% | 0.81% | 0.34% | -0.10% | 0.48% | |
| NZD | 0.62% | 0.11% | 0.02% | 0.91% | 0.39% | 0.10% | 0.48% | |
| CHF | 0.15% | -0.37% | -0.46% | 0.35% | -0.02% | -0.48% | -0.48% |
The heat map shows percentage changes of major currencies against each other. The base currency is picked from the left column, while the quote currency is picked from the top row. For example, if you pick the Euro from the left column and move along the horizontal line to the US Dollar, the percentage change displayed in the box will represent EUR (base)/USD (quote).
The US Bureau of Labor Statistics (BLS) reported on Tuesday that the Producer Price Index (PPI) rose 2.2% on a yearly basis in April, following the 1.8% increase recorded in March. This print matched the market expectation but failed to provide a lasting boost to the US Dollar (USD). Meanwhile, Federal Reserve (Fed) Chairman Jerome Powell reiterated that they might have to stick to the restrictive policy for longer than expected to bring inflation down toward the 2% target.
Later in the day, the BLS will release the Consumer Price Index (CPI) data for April. Markets expect the core CPI to rise 0.3% on a monthly basis. A reading of 0.4% or higher could cause investors to refrain from pricing in a rate cut in September and allow the USD to gather strength. On the other hand, a soft monthly core CPI print of 0.2% or lower could cause the USD selloff to pick up steam.
According to the CME FedWatch Tool, investors are currently pricing in a nearly 35% probability that the Fed will leave the policy rate unchanged in September. This market positioning suggests that the USD is facing a two-way risk ahead of the data release.
EUR/USD Technical Analysis
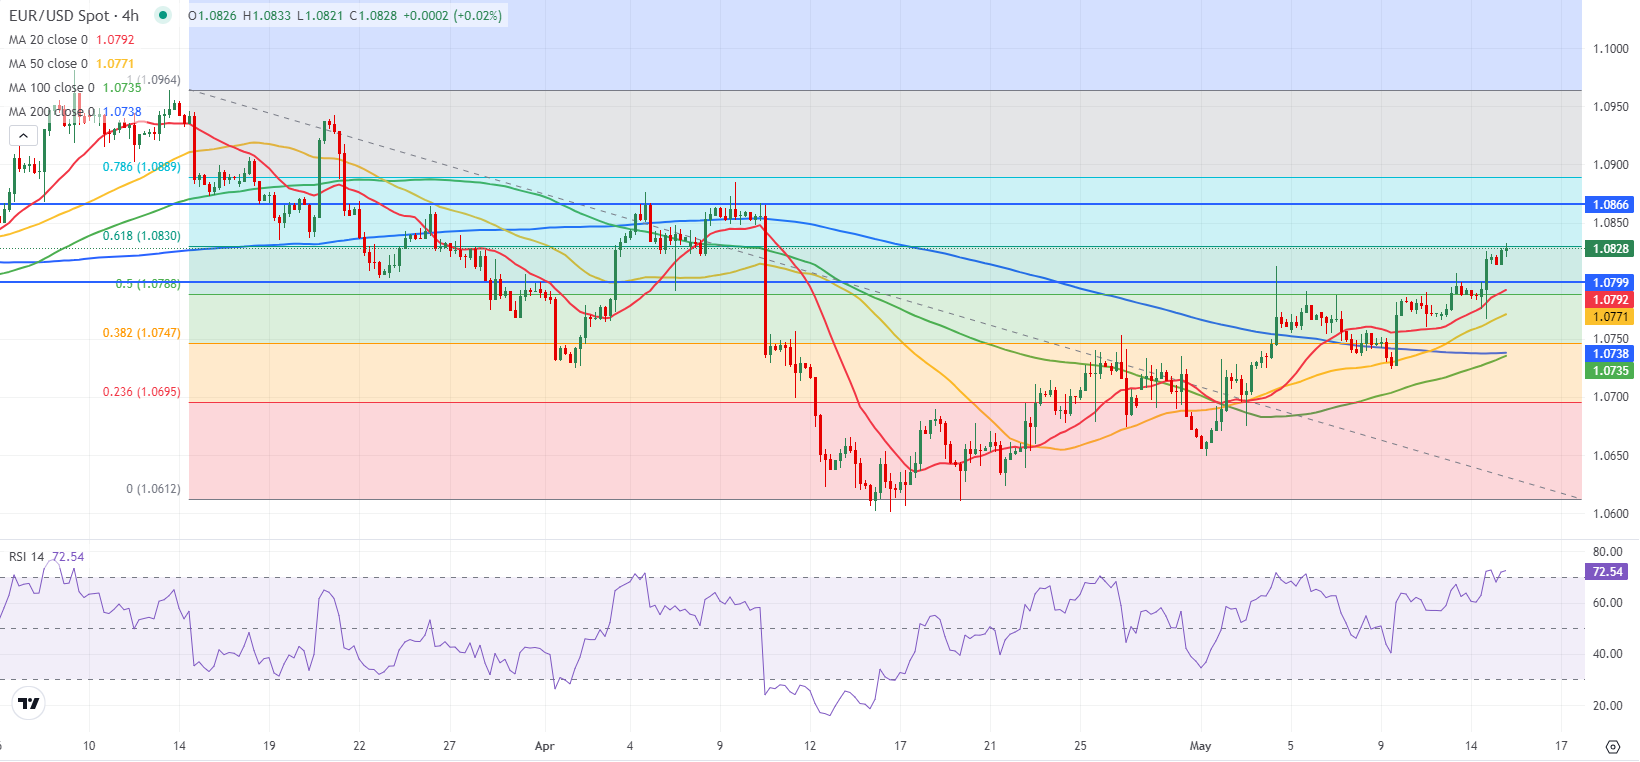
EUR/USD holds comfortably above 1.0790-1.0800, where the 50-day and the 200-day Simple Moving Averages (SMA) align. In the meantime, the Relative Strength Index (RSI) indicator on the 4-hour chart holds above 70, pointing to overbought conditions. Nevertheless, sellers are likely to remain on the sidelines in case 1.0790-1.0800 area holds as support.
On the upside, 1.0865 (static level) aligns as interim resistance before 1.0890-1.0900 (Fibonacci 78.6% retracement of the latest downtrend, psychological level) and 1.0960 (beginning point of the downtrend).
If the pair returns below 1.0790-1.0800 area and starts using it as resistance, sellers could take action. In this scenario, 1.0740-1.0750 (Fibonacci 38.2% retracement, 200-period Simple Moving Average (SMA) on the 4-hour chart) could be seen as next support.
Economic Indicator
Consumer Price Index (YoY)
Inflationary or deflationary tendencies are measured by periodically summing the prices of a basket of representative goods and services and presenting the data as The Consumer Price Index (CPI). CPI data is compiled on a monthly basis and released by the US Department of Labor Statistics. The YoY reading compares the prices of goods in the reference month to the same month a year earlier.The CPI is a key indicator to measure inflation and changes in purchasing trends. Generally speaking, a high reading is seen as bullish for the US Dollar (USD), while a low reading is seen as bearish.
Read more.Next release: Wed May 15, 2024 12:30
Frequency: Monthly
Consensus: 3.4%
Previous: 3.5%
Source: US Bureau of Labor Statistics
The US Federal Reserve has a dual mandate of maintaining price stability and maximum employment. According to such mandate, inflation should be at around 2% YoY and has become the weakest pillar of the central bank’s directive ever since the world suffered a pandemic, which extends to these days. Price pressures keep rising amid supply-chain issues and bottlenecks, with the Consumer Price Index (CPI) hanging at multi-decade highs. The Fed has already taken measures to tame inflation and is expected to maintain an aggressive stance in the foreseeable future.
Author
Eren Sengezer
FXStreet
As an economist at heart, Eren Sengezer specializes in the assessment of the short-term and long-term impacts of macroeconomic data, central bank policies and political developments on financial assets.