EUR/USD Forecast: Consolidative phase continues with scope for additional gains

EUR/USD Current Price: 1.1036
- Financial markets are trying to assess central banks’ decisions and the banking crisis.
- European data came in worse than anticipated, EUR benefits from broad US Dollar’s weakness.
- EUR/USD is technically neutral-to-bullish, with buyers likely to take their chances at lower levels.
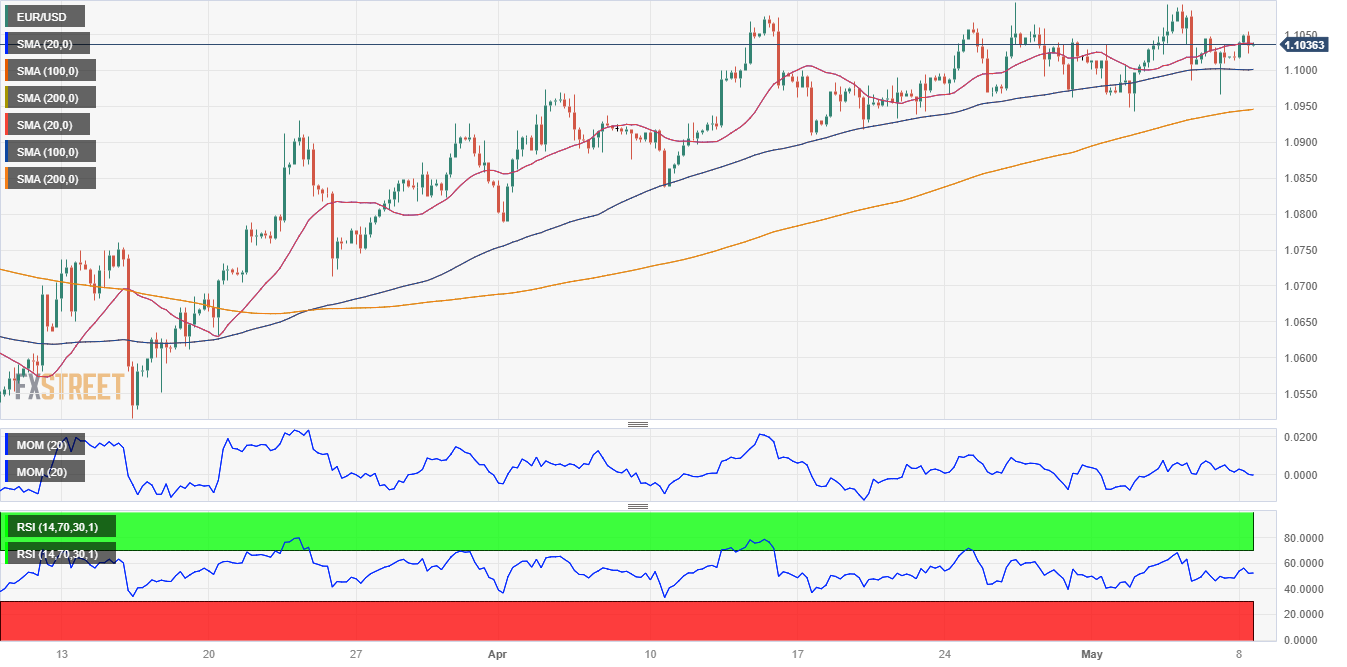
The EUR/USD pair maintains its bullish poise on Monday, trading around the 1.1040 level ahead of the American opening. Financial markets are trying to assess the latest central banks’ decisions, as the United States Federal Reserve (Fed) and the European Central Bank (ECB) hiked their respective benchmark rates by 25 basis points (bps) last week.
However, the Fed signalled a potential pause by dropping the wording saying, “the Committee anticipates that some additional policy firming may be appropriate,” while ECB President Christine Lagarde moved in the opposite direction and noted that an on-hold stance was never on the table, and that, given that inflation remains too high, there’s much to be done. The most common ground between authorities from the two central banks was that they reaffirmed their respective banking systems remain sound and resilient, despite the unfolding banking crisis that keeps speculative interest in cautious mode.
Meanwhile, the Euro advances despite tepid Eurozone (EU) data. German Industrial Production declined by 3.4% MoM in March, much worse than anticipated, while EU Sentix Investor Confidence plunged to -13.1 in May from -8.7 in the previous month. The US calendar will include March Wholesale Inventories and the Q1 Fed’s Loan Officer Survey, relevant amid the banking crisis.
EUR/USD short-term technical outlook
From a technical perspective, the EUR/USD pair extends its consolidative phase, with scope to extend its advance. The daily chart shows that buyers continue to defend the downside around a bullish 20 Simple Moving Average (SMA), which advances well above the longer ones, and currently stands at around 1.0990. Technical indicators, in the meantime, lack directional strength but hold within positive levels.
In the near term, and according to the 4-hour chart, the bullish potential seems limited. EUR/USD seesaws around a mildly bullish 20 SMA, while the 100 SMA has lost directional strength and remains flat at around 1.1000. Furthermore, the Momentum indicator heads firmly south within negative levels, while the Relative Strength Index (RSI) indicator consolidates at neutral levels. The bearish case could be more precise once below 1.0985, although buyers will likely reappear around 1.0940. On the other hand, bulls could take over on a break above 1.1060.
Support levels: 1.0985 1.0940 1.0890
Resistance levels: 1.1060 1.1100 1.1160
Author

Valeria Bednarik
FXStreet
Valeria Bednarik was born and lives in Buenos Aires, Argentina. Her passion for math and numbers pushed her into studying economics in her younger years.

















