EUR/USD Forecast: Buyers retain control but await first-tier events

EUR/USD Current Price: 1.1011
- Speculative interest pared US Dollar buying ahead of Wall Street’s opening.
- The United States will publish the April ISM Manufacturing PMI, foreseen at 46.6.
- EUR/USD holds around 1.1000, with selling interest out of the picture for now.
The EUR/USD pair fell on Monday to 1.0987, as the US Dollar extended its Friday’s momentum throughout the Asian session. The Greenback gave back some ground during the European morning, as volumes declined sharply amid the Labour Day holiday that kept local markets closed.
Month-end flows after hotter-than-expected United States inflation-related figures released on Friday spurred volatility ahead of the weekly close, resulting in EUR/USD ending the week at 1.1015. The pair currently struggles around 1.1000 as speculative interest gears up for the American session opening and multiple first-tier events throughout the week.
Over the upcoming days, the Federal Reserve (Fed) and the European Central Bank (ECB) will announce their decisions on monetary policy. Additionally, the Eurozone (EU) will unveil the preliminary estimates of April inflation figures, while the United States (US) will close the week by publishing the Nonfarm Payrolls (NFP) report on Friday.
The Eurozone macroeconomic calendar had nothing to offer at the beginning of the week, but the US one will bring the April ISM Manufacturing PMI, foreseen at 46.6, slightly better than the previous 46.3. In addition, the country will publish March Construction Spending, while S&P Global will release the final estimate of the April Manufacturing PMI, expected to be confirmed at 50.4.
EUR/USD short-term technical outlook
The EUR/USD pair posts modest losses for a third consecutive day and trades a handful of pips above the 1.1000 threshold. Technical readings in the daily chart suggest that bulls are still in control of the pair, as a mildly bullish 20 Simple Moving Average (SMA) that advances above the longer ones provides dynamic support, currently at 1,0970. Furthermore, the 100 SMA extended its advance above a critical Fibonacci level, the 61.8% retracement of the 2022 yearly decline at 1.0745. Finally, technical indicators ease within positive levels, reflecting the absence of upward momentum rather than suggesting upward exhaustion.
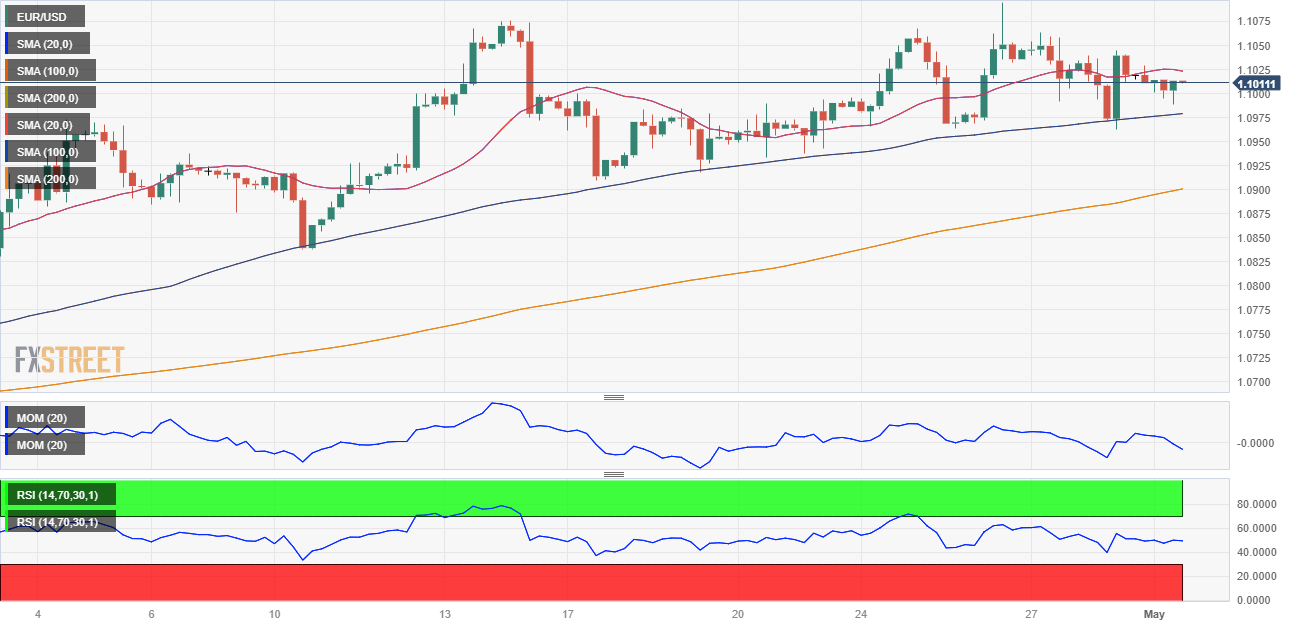
In the near term, and according to the 4-hour chart, the pair fails to provide directional clues. EUR/USD trades above its 100 SMA but below the 20 SMA, both lacking directional strength. The 200 SMA, in the meantime, stands far below the current level, partially losing its upward strength. At the same time, technical indicators have turned higher but remain within negative levels. Bulls will have better chances if the pair breaks through 1.1045, while buyers will add longs if the pair slides towards 1.0950.
Support levels: 1.0985 1.0950 1.0910
Resistance levels: 1.1045 1.1100 1.1160
Author

Valeria Bednarik
FXStreet
Valeria Bednarik was born and lives in Buenos Aires, Argentina. Her passion for math and numbers pushed her into studying economics in her younger years.

















