EUR/USD Forecast: Bulls gear up for a definite break of 1.1000

EUR/USD Current Price: 1.0983
- Tepid German data undermined demand for the Euro, as Economic Sentiment provided a negative surprise.
- The United States session will feature multiple Federal Reserve speakers.
- EUR/USD corrects near-term overbought conditions, bulls retain the lead.
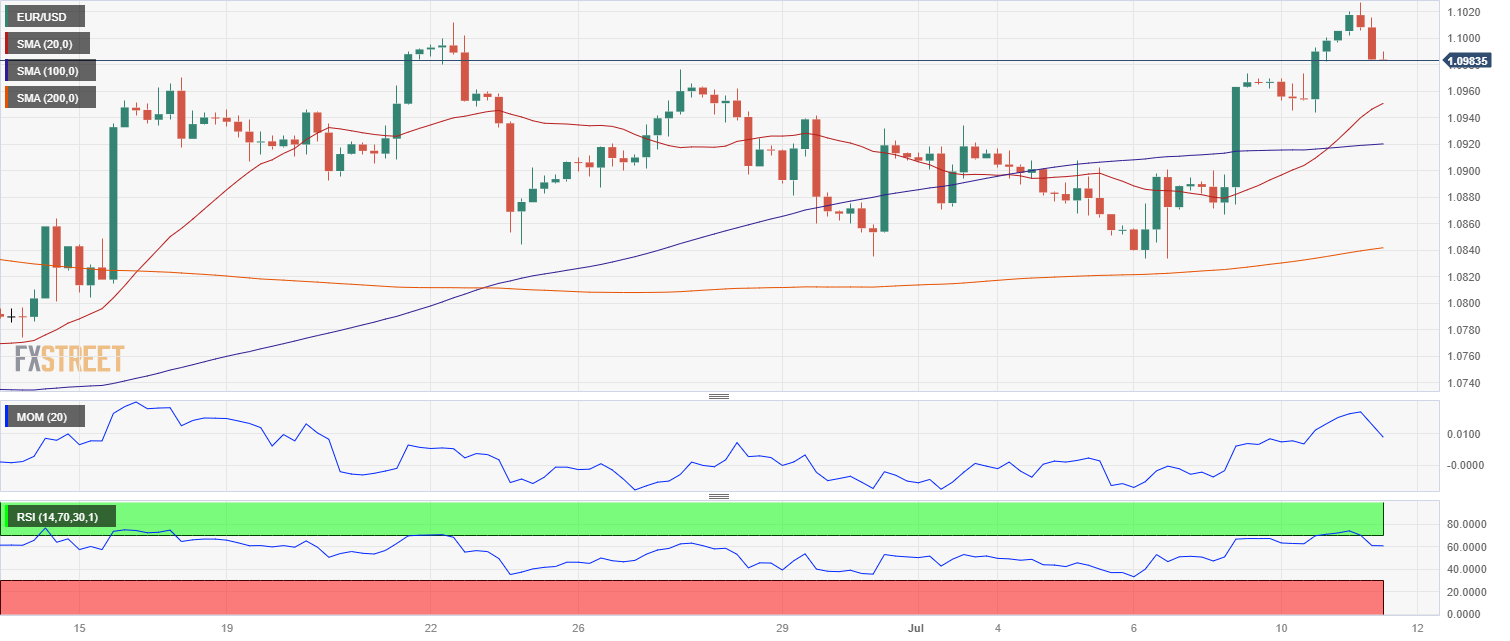
The EUR/USD pair rallied to 1.1026 on Tuesday, its highest since May 8, as the US Dollar accelerated its slide during Asian trading hours. Market participants shrugged off growth-related concerns and resumed buying high-yielding assets while easing government bond yields undermined demand for the USD.
The Euro lost momentum in the European session following uneventful data. Germany confirmed the Harmonized Index of Consumer Prices (HICP) rose by 6.8% YoY in June, as previously estimated. However, the ZEW Survey showed that the Economic Sentiment in the country contracted to -14.7, while the Eurozone figure came down to -12.2, both missing the market’s expectations. The assessment of the current situation also declined from June, although it came in better than anticipated at -59.5. The figures put some pressure on the Euro, forcing EUR/USD to give up some ground ahead of Wall Street’s opening.
The tide seems to be turning ahead of Wall Street’s opening as the US Dollar regains its bullish poise. The United States (US) will not publish relevant figures, although multiple Federal Reserve (Fed) officials will be on the wires. The hawkish tone from Fed officials takes its toll on financial markets. On Monday, San Francisco Fed President Mary Daly said that the positive economic momentum allows them to raise rates. “With labor market still strong, inflation high, risks of doing too little are outweighing risks of doing too much,” she added.
EUR/USD short-term technical outlook
The EUR/USD pair currently trades in the 1.0980 price zone, and the daily chart shows that it turned red. Nevertheless, the pair continues to develop above all its moving averages, with the 20 Simple Moving Average (SMA) providing dynamic support at 1.0920 while advancing above the longer ones. At the same time, technical indicators have lost their bullish strength. The Momentum indicator turned south and hovers around its 100 level, while the Relative Strength Index (RSI) indicator consolidates at around 59, the latter limiting the chances of a steeper decline.
In the near term, the decline seems corrective. The 4-hour chart shows technical indicators retreat from overbought territory, heading firmly lower, although well into positive ground. Meanwhile, a bullish 20 SMA accelerated north and crossed above a flat 100 SMA well below the current level, in line with the dominant bullish trend.
Support levels: 1.0920 1.0870 1.0820
Resistance levels: 1.1020 1.1050 1.1090
Author

Valeria Bednarik
FXStreet
Valeria Bednarik was born and lives in Buenos Aires, Argentina. Her passion for math and numbers pushed her into studying economics in her younger years.