EUR/USD Forecast: Bad news from Europe boost selling

EUR/USD Current Price: 1.0962
- The Eurozone Harmonized Index of Consumer Prices rose more than anticipated in April.
- Government bond yields ease, while stock markets trade in the red as caution arises.
- EUR/USD pressures fresh lows and has room to extend its decline.
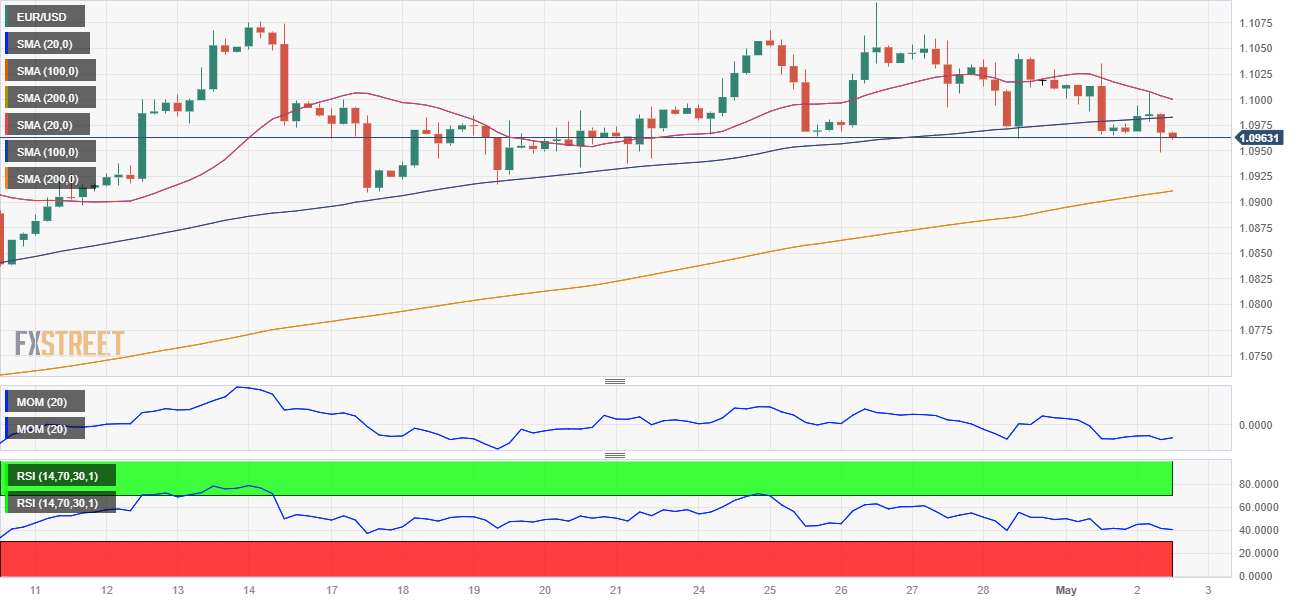
The EUR/USD pair extended its slide on Tuesday, bottoming so far at 1.0947. The Euro is among the US Dollar’s weakest rivals amid bad news from the Eurozone (EU). On the one hand, the EU Harmonized Index of Consumer Prices(HICP) rose by 7% YoY in April and, according to preliminary estimates, higher than anticipated. The core annual HICP, however, was up by 1%, decreasing from the previous 1.3%. Additionally, Germany reported that Retail Sales plummeted in March, down by 2.4% in the month and by 8.6% from a year earlier.
Meanwhile, the European Central Bank (ECB) published the Bank Lending Survey (BLS), which showed that 38% of EU banks reported a fall in demand for credit from companies in the first quarter of the year, while 27% reported tightening of lending standards for companies in the same period.
The US Dollar, in the meantime, loses momentum amid easing US Treasury yields. Following Monday’s rally, the 10-year Treasury note yields 3.54%, while the 2-year note offers 4.13%. Stock markets trade with a soft tone, with most major indexes in the red, reflecting mounting caution ahead of the US Federal Reserve (Fed) monetary policy decision on Wednesday.
The United States macroeconomic calendar will be light this Tuesday. The country will publish March Factory Orders and JOLTS Job Openings for the same month.
EUR/USD short-term technical outlook
From a technical point of view, the risk of a bearish continuation in EUR/USD has increased. The daily chart shows that the pair is battling a now flat 20 Simple Moving Average (SMA) while the longer moving averages partially lose their upward strength far below the shorter one. Technical indicators, in the meantime, maintain their downward slopes. The Momentum indicator is crossing its 100 line into negative territory, while the Relative Strength Index (RSI) currently stands at 52.
For the near term, the 4-hour chart shows that the risk skews to the downside. A flat 100 SMA provides intraday resistance at around 1.0980, while the 20 SMA gains downward traction above the longer one. At the same time, technical indicators seesaw within negative levels without clear directional strength. Nevertheless, renewed selling interest below 1.0950 should lead to a bearish continuation throughout the upcoming sessions.
Support levels: 1.0950 1.0910 1.0860
Resistance levels: 1.1000 1.1045 1.1100
Author

Valeria Bednarik
FXStreet
Valeria Bednarik was born and lives in Buenos Aires, Argentina. Her passion for math and numbers pushed her into studying economics in her younger years.

















