EUR/USD Forecast: Aiming to break below 1.0900

EUR/USD Current Price: 1.0936
- European Central Bank Consumer Expectations Survey hinting at continued price pressures.
- United States Initial Jobless Claims unexpectedly jumped to 264K in the week ended May 5.
- EUR/USD under pressure near a fresh weekly low, break through 1.0900 on the table.
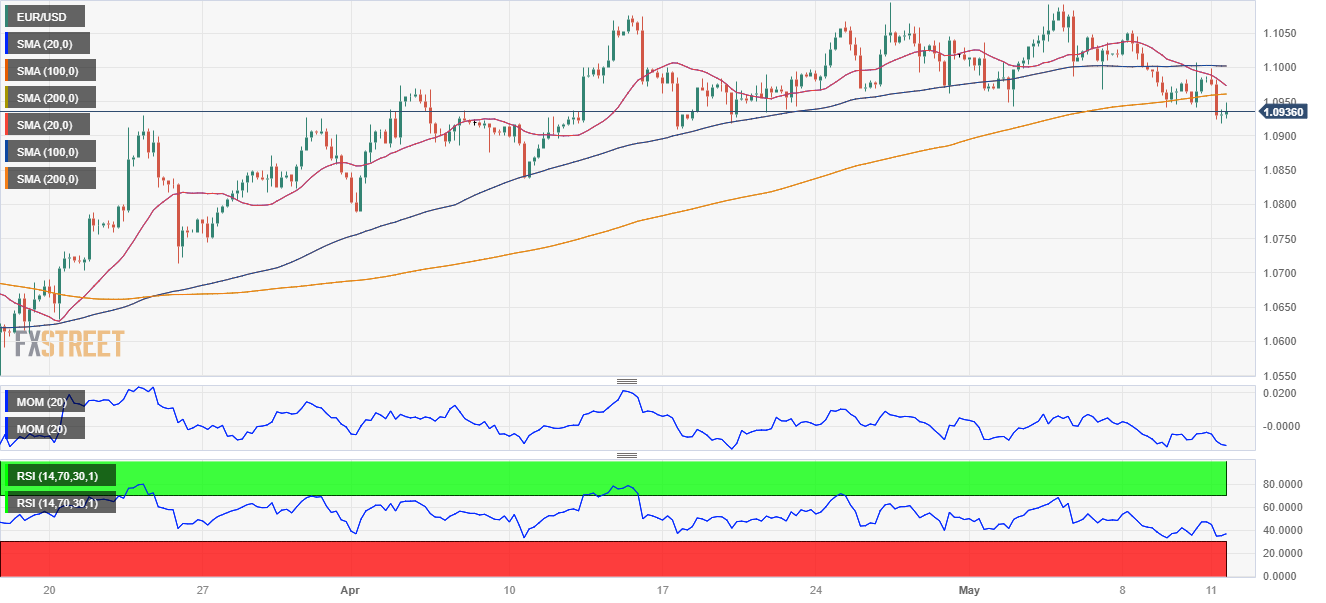
The EUR/USD pair maintained its negative stance early on Thursday, reaching a fresh weekly low of 1.0917 during London trading hours. The US Dollar appreciated amid a persistent dismal mood and despite the poor performance of government bond yields. Ahead of Wall Street’s opening, the 10-year note yields 3.36%, down 6 basis points (bps), while the 2-year note offers 3.83%, shedding 6 bps.
As for the Euro, the European currency declined following comments from European Central Bank (ECB) official Joachim Nagel, who repeated ECB’s decisions will be taken meeting-by-meeting, dismissing speculation of a September rate hike. Additionally, the ECB released the Consumer Expectations Survey, which showed that consumer inflation expectations increased “significantly” in March, while expectations for economic growth over the next 12 months became “slightly more negative.”
On the data front, the United States (US) released Initial Jobless Claims for the week ended May 5, which unexpectedly jumped to 264K, much worse than the 245K expected. On a positive note, the Producer Price Index (PPI) increased by 2.3% YoY in April, below the previous 2.7% and less than the 2.4% forecast. Compared to the previous month, the PPI was up a modest 0.2%, also beating the market expectations.
EUR/USD short-term technical outlook
The EUR/USD pair bounced modestly from the aforementioned weekly low, and the risk skews to the downside, according to the daily chart. The pair is meeting sellers around a mildly bearish 20 Simple Moving Average (SMA) for a third consecutive day, although the longer moving averages maintain their bullish slopes well below the current level. Nevertheless, technical indicators head south within negative levels, suggesting a continued decline ahead of the weekly close.
In the near term, and according to the 4-hour chart, bears are in control. The pair is developing below all its moving averages, with the 20 SMA gaining bearish strength below a still directionless 100 SMA. Technical indicators, in the meantime, head marginally higher but remain well into negative territory and below their daily highs, hinting at limited buying interest. A steeper decline could be expected on a break below 1.0890, a strong static support level.
Support levels: 1.0890 1.0830 1.0785
Resistance levels: 1.0955 1.1000 1.1050
Author

Valeria Bednarik
FXStreet
Valeria Bednarik was born and lives in Buenos Aires, Argentina. Her passion for math and numbers pushed her into studying economics in her younger years.

















