EUR/USD: engulfing candle at resistance on the daily chart makes it look bearish
EUR/USD produced a bearish engulfing candle on Friday at a Double Top resistance on the daily chart. Today’s intraday price action has been choppy so far. The price may go towards the upside to find its resistance and head towards the South again. Major intraday charts such as the H4 and the H1 are bearish biased as well. Thus, the sellers may dominate in the pair up to the level of the last swing low on the daily chart.
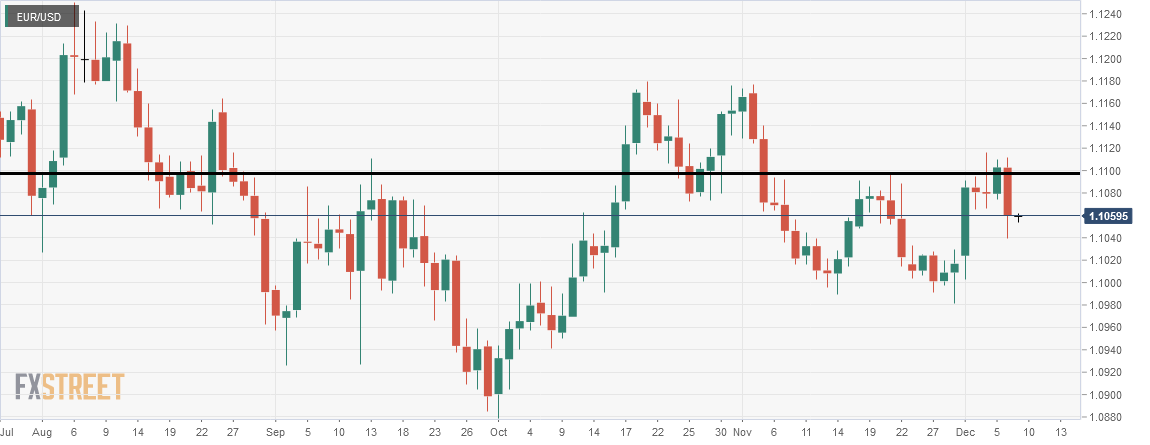
The chart shows that Friday’s daily candle formed at the level of 1.1100. This is the level, where the price had its last rejection. Typically, a bearish engulfing candle at a Double Top resistance attracts the sellers to go short on the pair. If the price makes a breakout at Friday’s lowest low, the price may head toward the level of 1.1000 with good bearish momentum. The risk-reward looks lucrative even for the daily sellers. Thus, it would be more lucrative for the H4 and the H1 traders. Let us now have a look at those two major intraday charts.
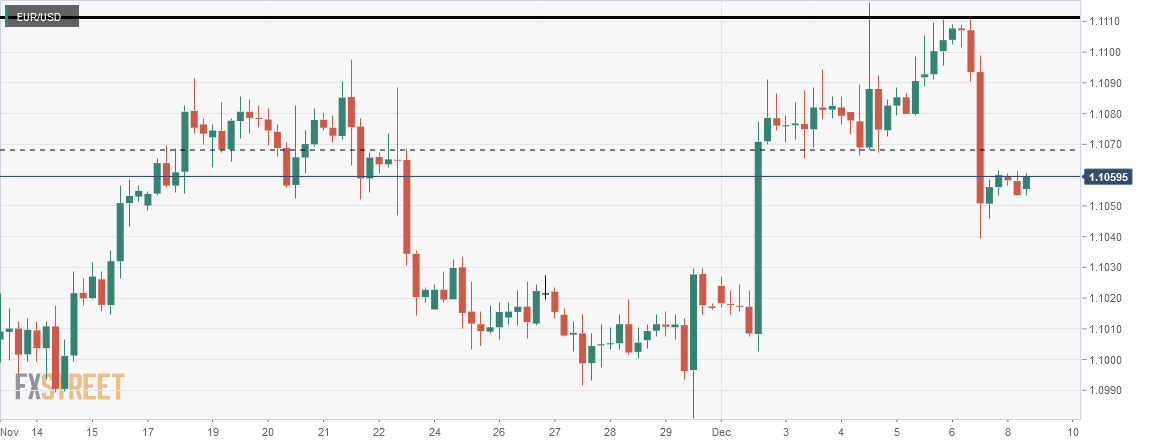
The chart shows that the price headed towards the South with extreme bearish pressure. It breached the level of 1.1070, which was the last swing low on the H4 chart. After making the breakout, the price has been on an upward correction. It may go towards the breakout level. If that happens, the sellers are to wait for a bearish reversal candle at the breakout level to go short. Considering ABC pattern, the last arm may extend up to the level of 1.1000. This is the level of the last swing low on the daily chart.
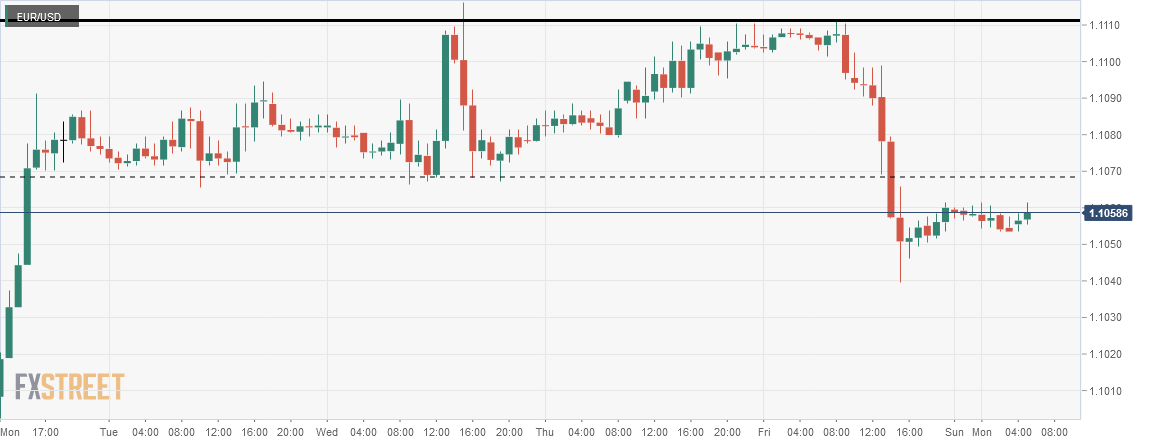
The H1 chart looks a bit tricky. The price has been slightly bullish biased now, which may push the price towards the breakout level to complete its correction. If the breakout level produces an H1 bearish reversal candle, the H1 traders may get themselves busy buying the pair. On the other hand, if the price makes an upside breakout at the resistance level, the price may head towards the level of 1.1110 upon breakout confirmation. The entry would allow them having good risk-reward.
The daily and the H4 chart look very bearish. However, the H1 chart does not give a clear indication. It could go either way. Considering the two most significant charts (the daily and the H4), most probably it would be bearish at the end.
Author

EagleFX Team
EagleFX
EagleFX Team is an international group of market analysts with skills in fundamental and technical analysis, applying several methods to assess the state and likelihood of price movements on Forex, Commodities, Indices, Metals and


