EUR/USD echoing a technically bearish vibe following ECB hike
The main highlight on the economic calendar on Thursday saw the European Central Bank (ECB) raise interest rates by another half-point (50 basis points) in an attempt to stem inflationary pressures. Euro area annual inflation for the month of February cooled to 8.5%, according to the flash estimate (the final CPI release is tomorrow at 10:00 am GMT). Before the ECB kicked rates higher, markets were split between a 25 basis-point increase or a 50 basis-point push. The Main Refinancing Rate now stands at 3.5%, while the Deposit Rate is 3.0% from 2.5%. The ECB also indicated that it is ready to offer banks liquidity if required.
In the immediate aftermath of the rate hike, the EUR/USD currency pair struggled to lock in on any concrete direction, initially spiking to a high of $1.0615 (and running stops above the psychological base $1.06) before pulling beyond pre-announcement levels to a low of $1.0551. Nevertheless, the price ended European trading on the front foot after reclaiming position above $1.06 during early US trading. Therefore, where are we regarding the technical picture on the EUR/USD?
Weekly timeframe exhibits scope to navigate lower levels
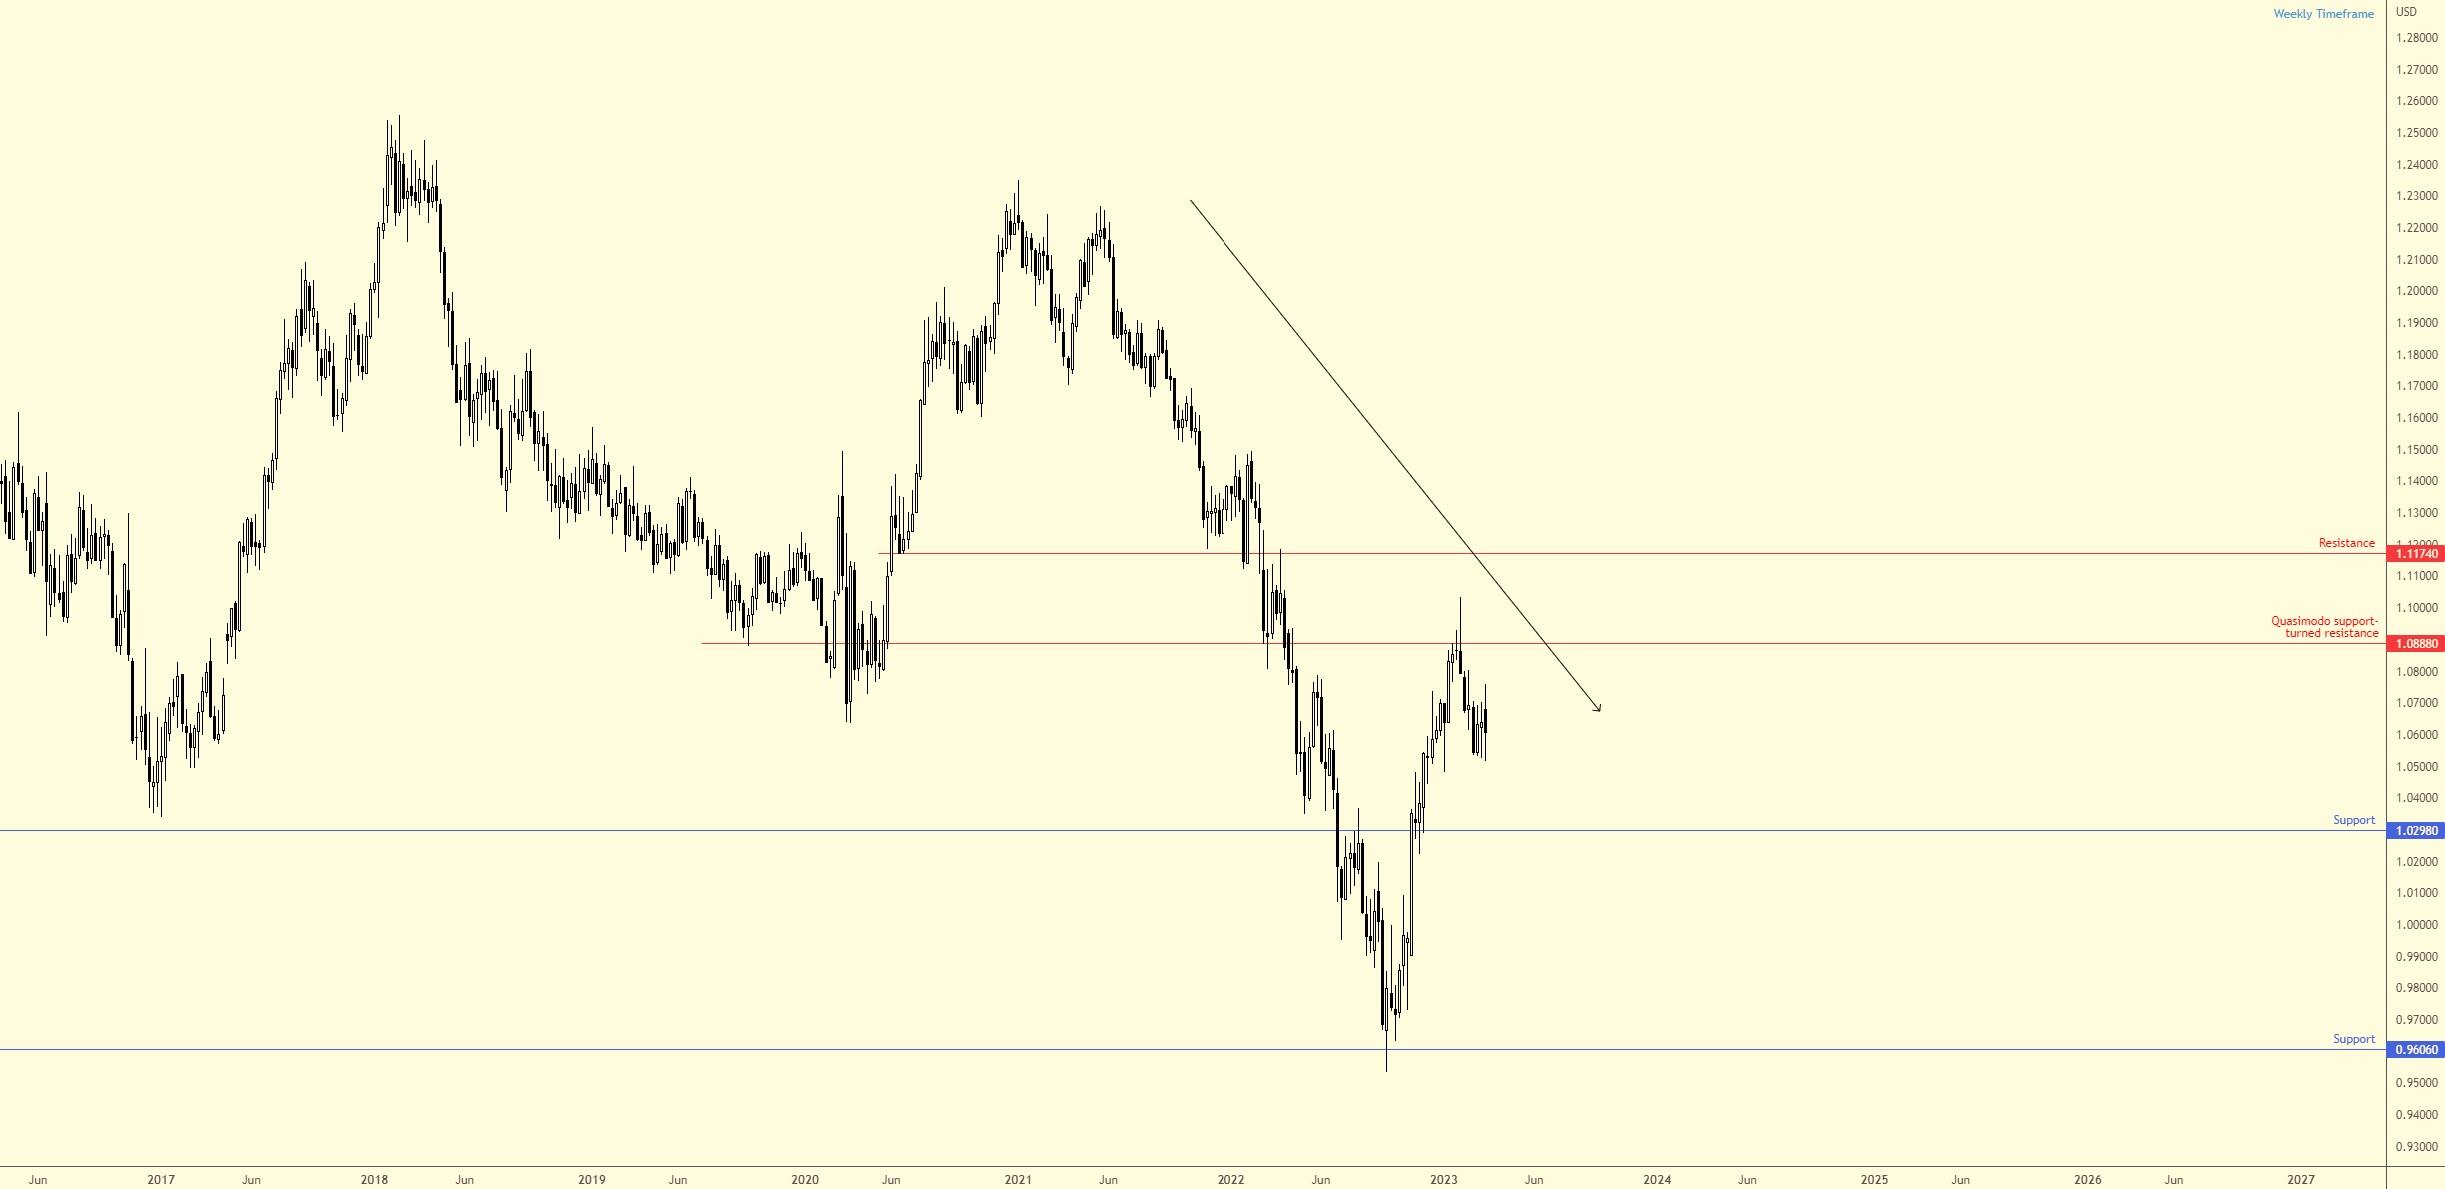
The weekly chart offers a simple and easy-to-read canvas. In Early 2023, the pair joined hands with Quasimodo support-turned-resistance at $1.0888 and established what is known as a shooting star Japanese candlestick formation (bearish). While we initially explored lower terrain from the said resistance, there has been some reluctance to continue probing lower levels in recent weeks. Despite this, technical evidence—that is, the downside bias in play since early 2021 and absence of support until $1.0298—swings the technical pendulum in favour of sellers on this timeframe.
Daily timeframe in alignment with weekly flow for now
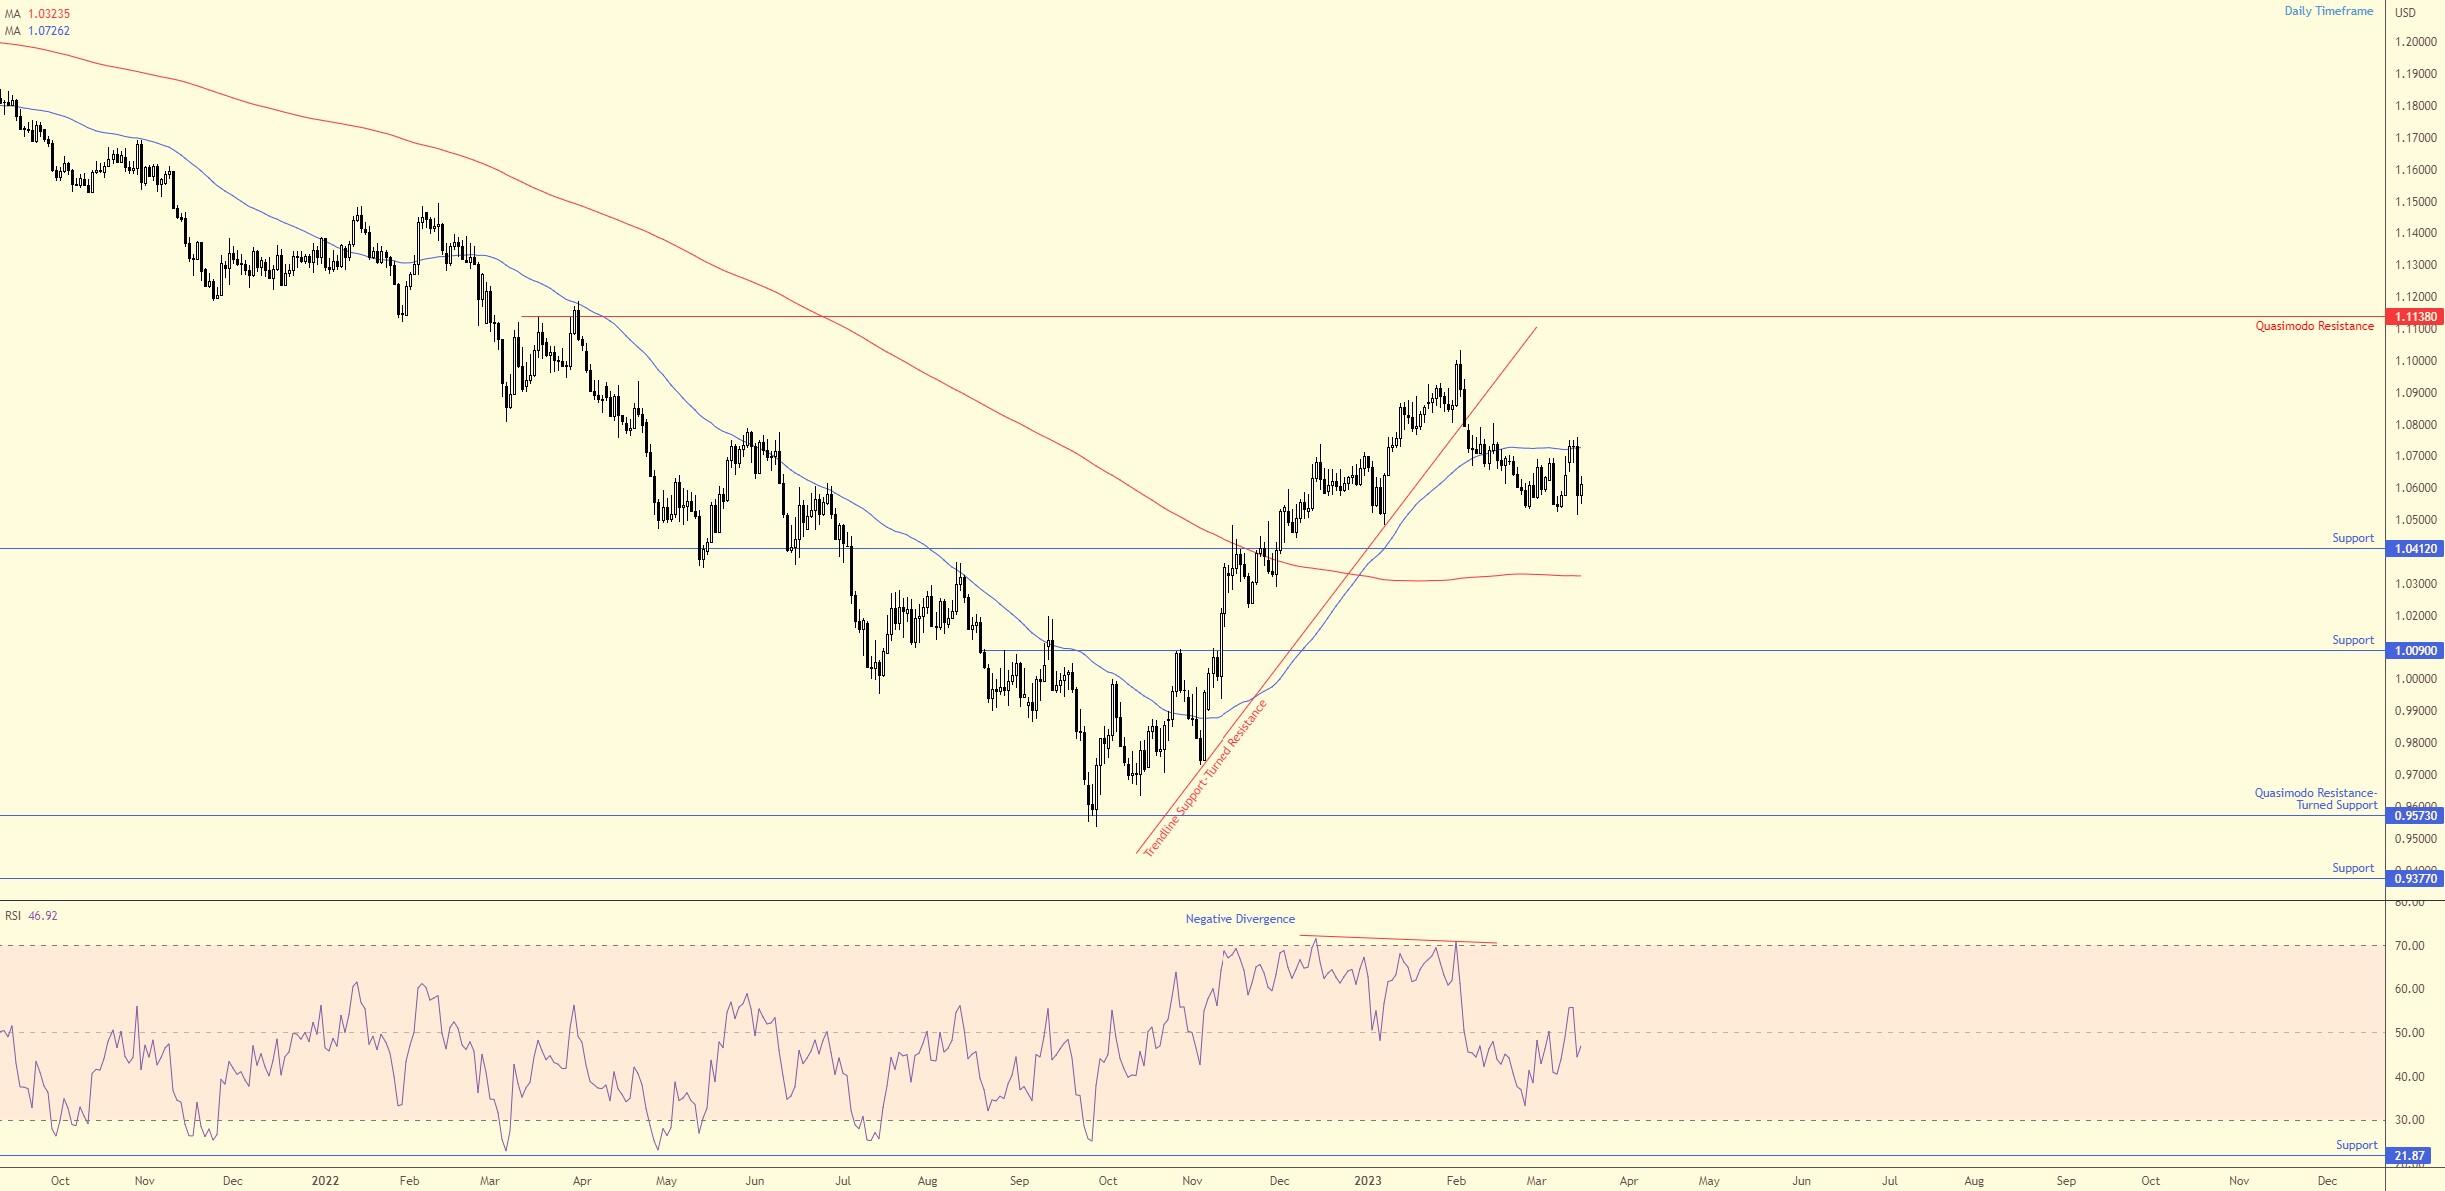
Against the backdrop of weekly price movement, action out of the daily timeframe recently rejected the lower side of the 200-day simple moving average at $1.0726. You will note that the currency pair has traded beneath this dynamic value since mid-February, which is considered by many technical analysts as a bearish trend reversal signal. Another key observation on the daily chart is the Relative Strength Index (RSI) rejecting the underside of its 50.00 centreline, adding weight to the bearish vibe.
To the downside, support warrants attention at $1.0412, closely shadowed by the 200-day simple moving average at $1.0324. As a result, short-term action could have the currency pair punch south to engage with the aforementioned supports, while engulfing the levels would help to reaffirm the weekly timeframe’s direction towards weekly support from $1.0298.
H1 chart features resistance at $1.0664
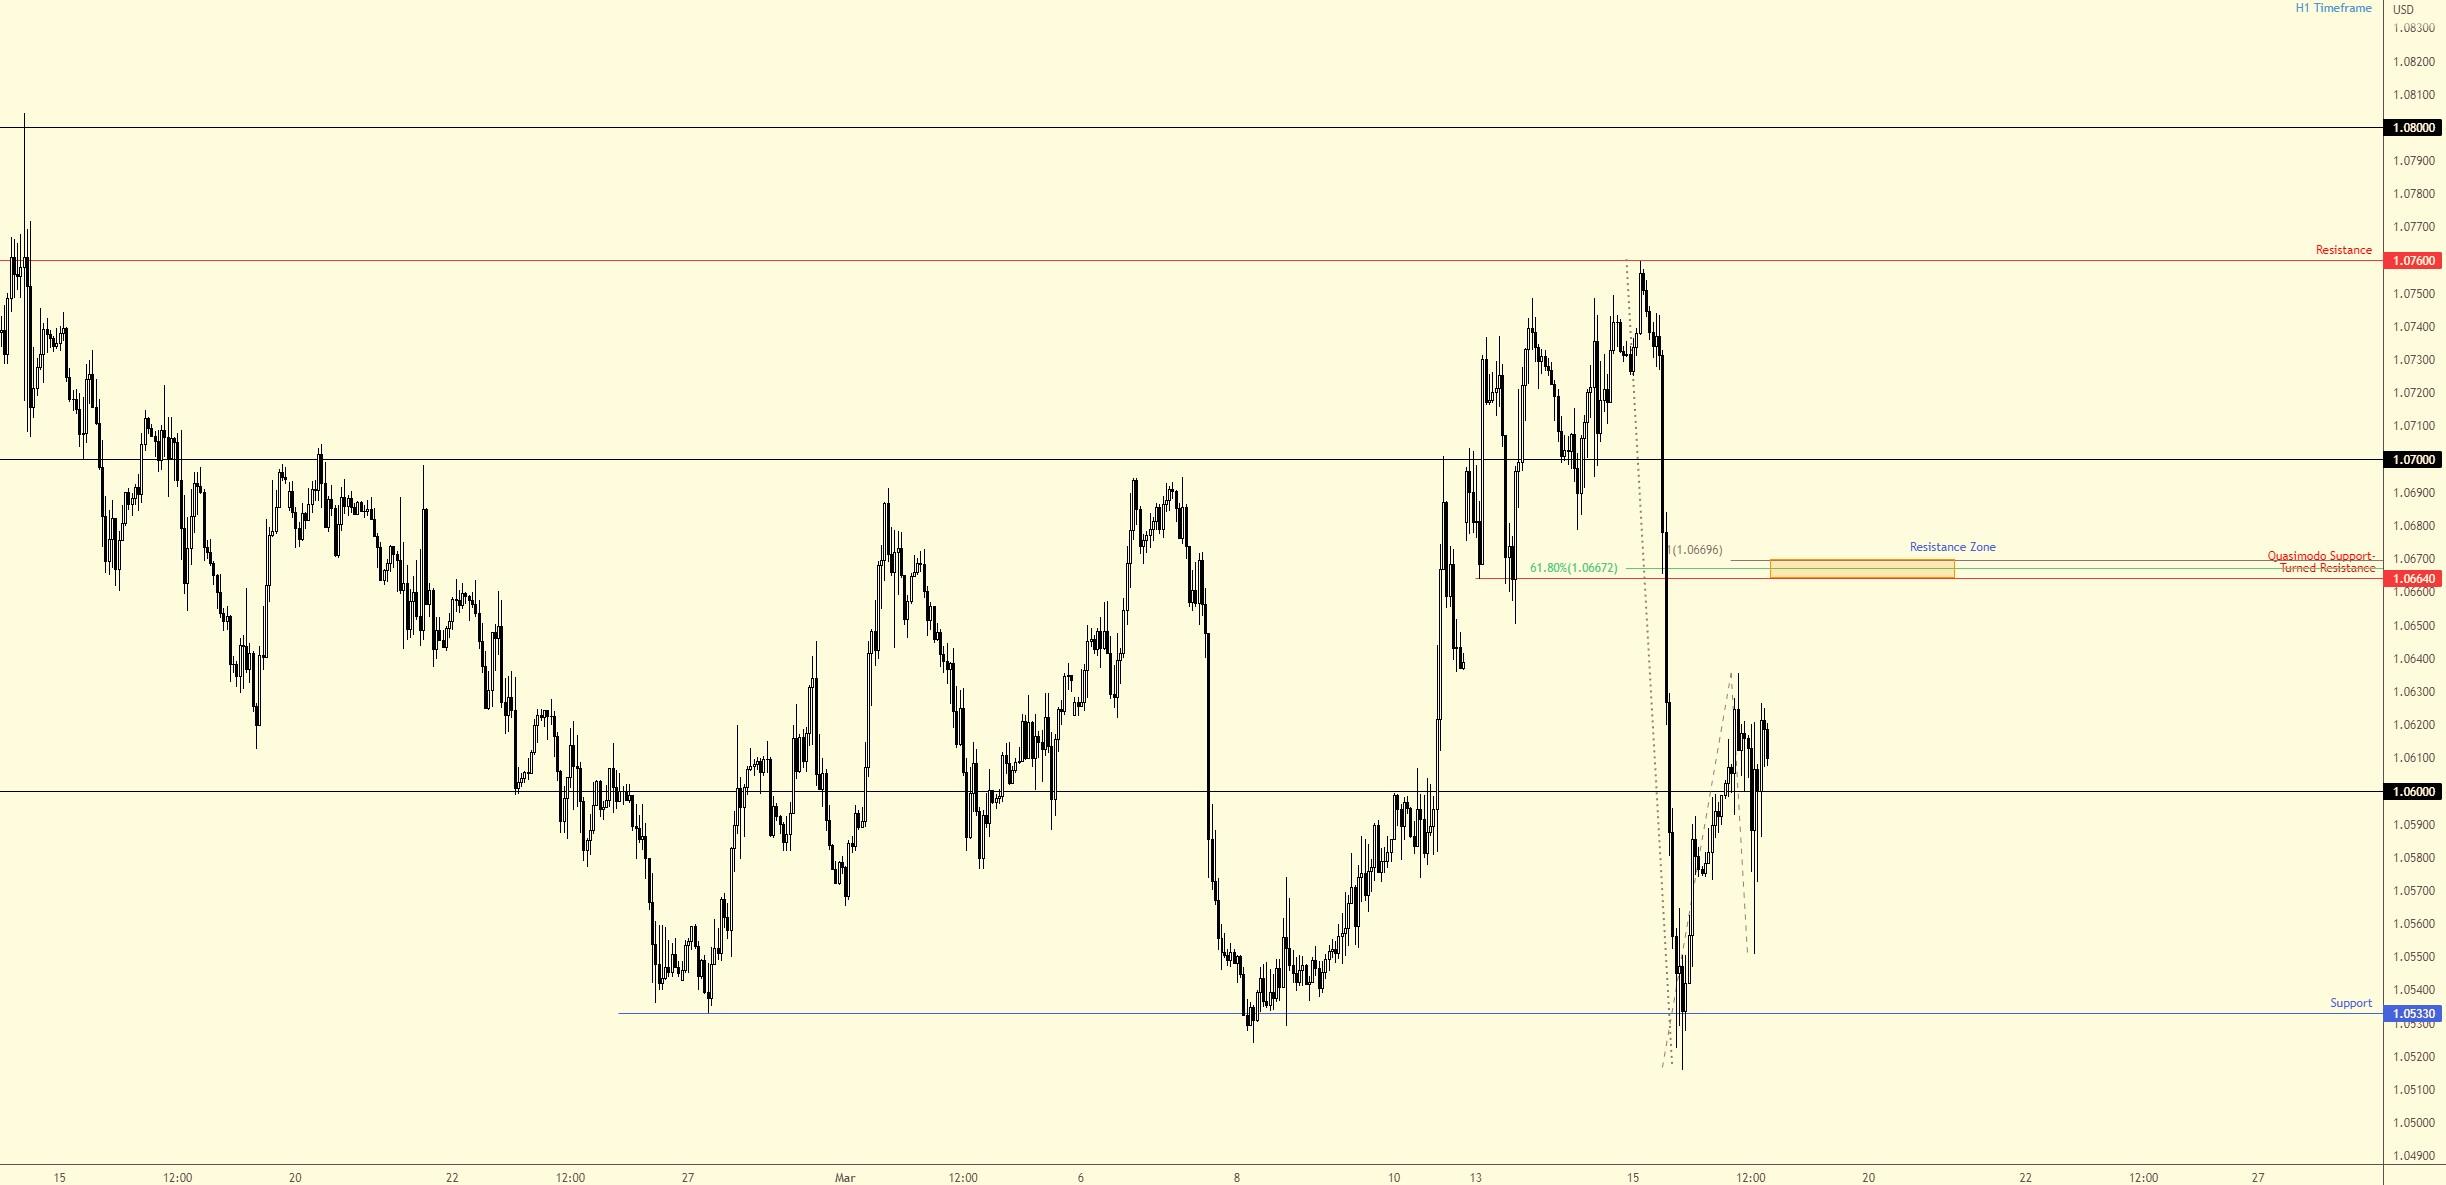
With the weekly and daily timeframes suggesting further selling could be on the table for the EUR/USD, and the H1 timeframe’s price action recently retaking $1.06 to the upside, H1 resistance between $1.0670 and $1.0664 may be an area sellers respond from if tested (made up of a Quasimodo support-turned-resistance at $1.0664, a 100% projection ratio at $1.0670 [some will also note this as an AB=CD bearish formation] and a 61.8% Fibonacci retracement ratio from $1.0667).
Consequently, should H1 remain above $1.06, a short-term push higher might be seen to approach the $1.0664ish resistance zone, where, according to the overall technical picture, sellers may emerge. Alternatively, failure to hold north of $1.06 opens the door to a bearish breakout scenario, targeting H1 support at $1.0533.
Author

Aaron Hill
FP Markets
After completing his Bachelor’s degree in English and Creative Writing in the UK, and subsequently spending a handful of years teaching English as a foreign language teacher around Asia, Aaron was introduced to financial trading,


