EUR/USD coils below 1.1600 as Warsh faces his first dot plot

Every new Fed chair gets one first meeting, and how they handle it often says more than the decision itself.
Paul Volcker arrived in 1979 and reshaped the institution within weeks. Alan Greenspan closed his 1987 debut by noting that no one in the room had mentioned the stock market, just two months before it crashed.
A first meeting is where a chair signals whether they came to steady the ship or rebuild it.
This afternoon, it is Kevin Warsh's turn. And the twist is that the most closely watched item on his desk is one he has openly criticized: the dot plot.
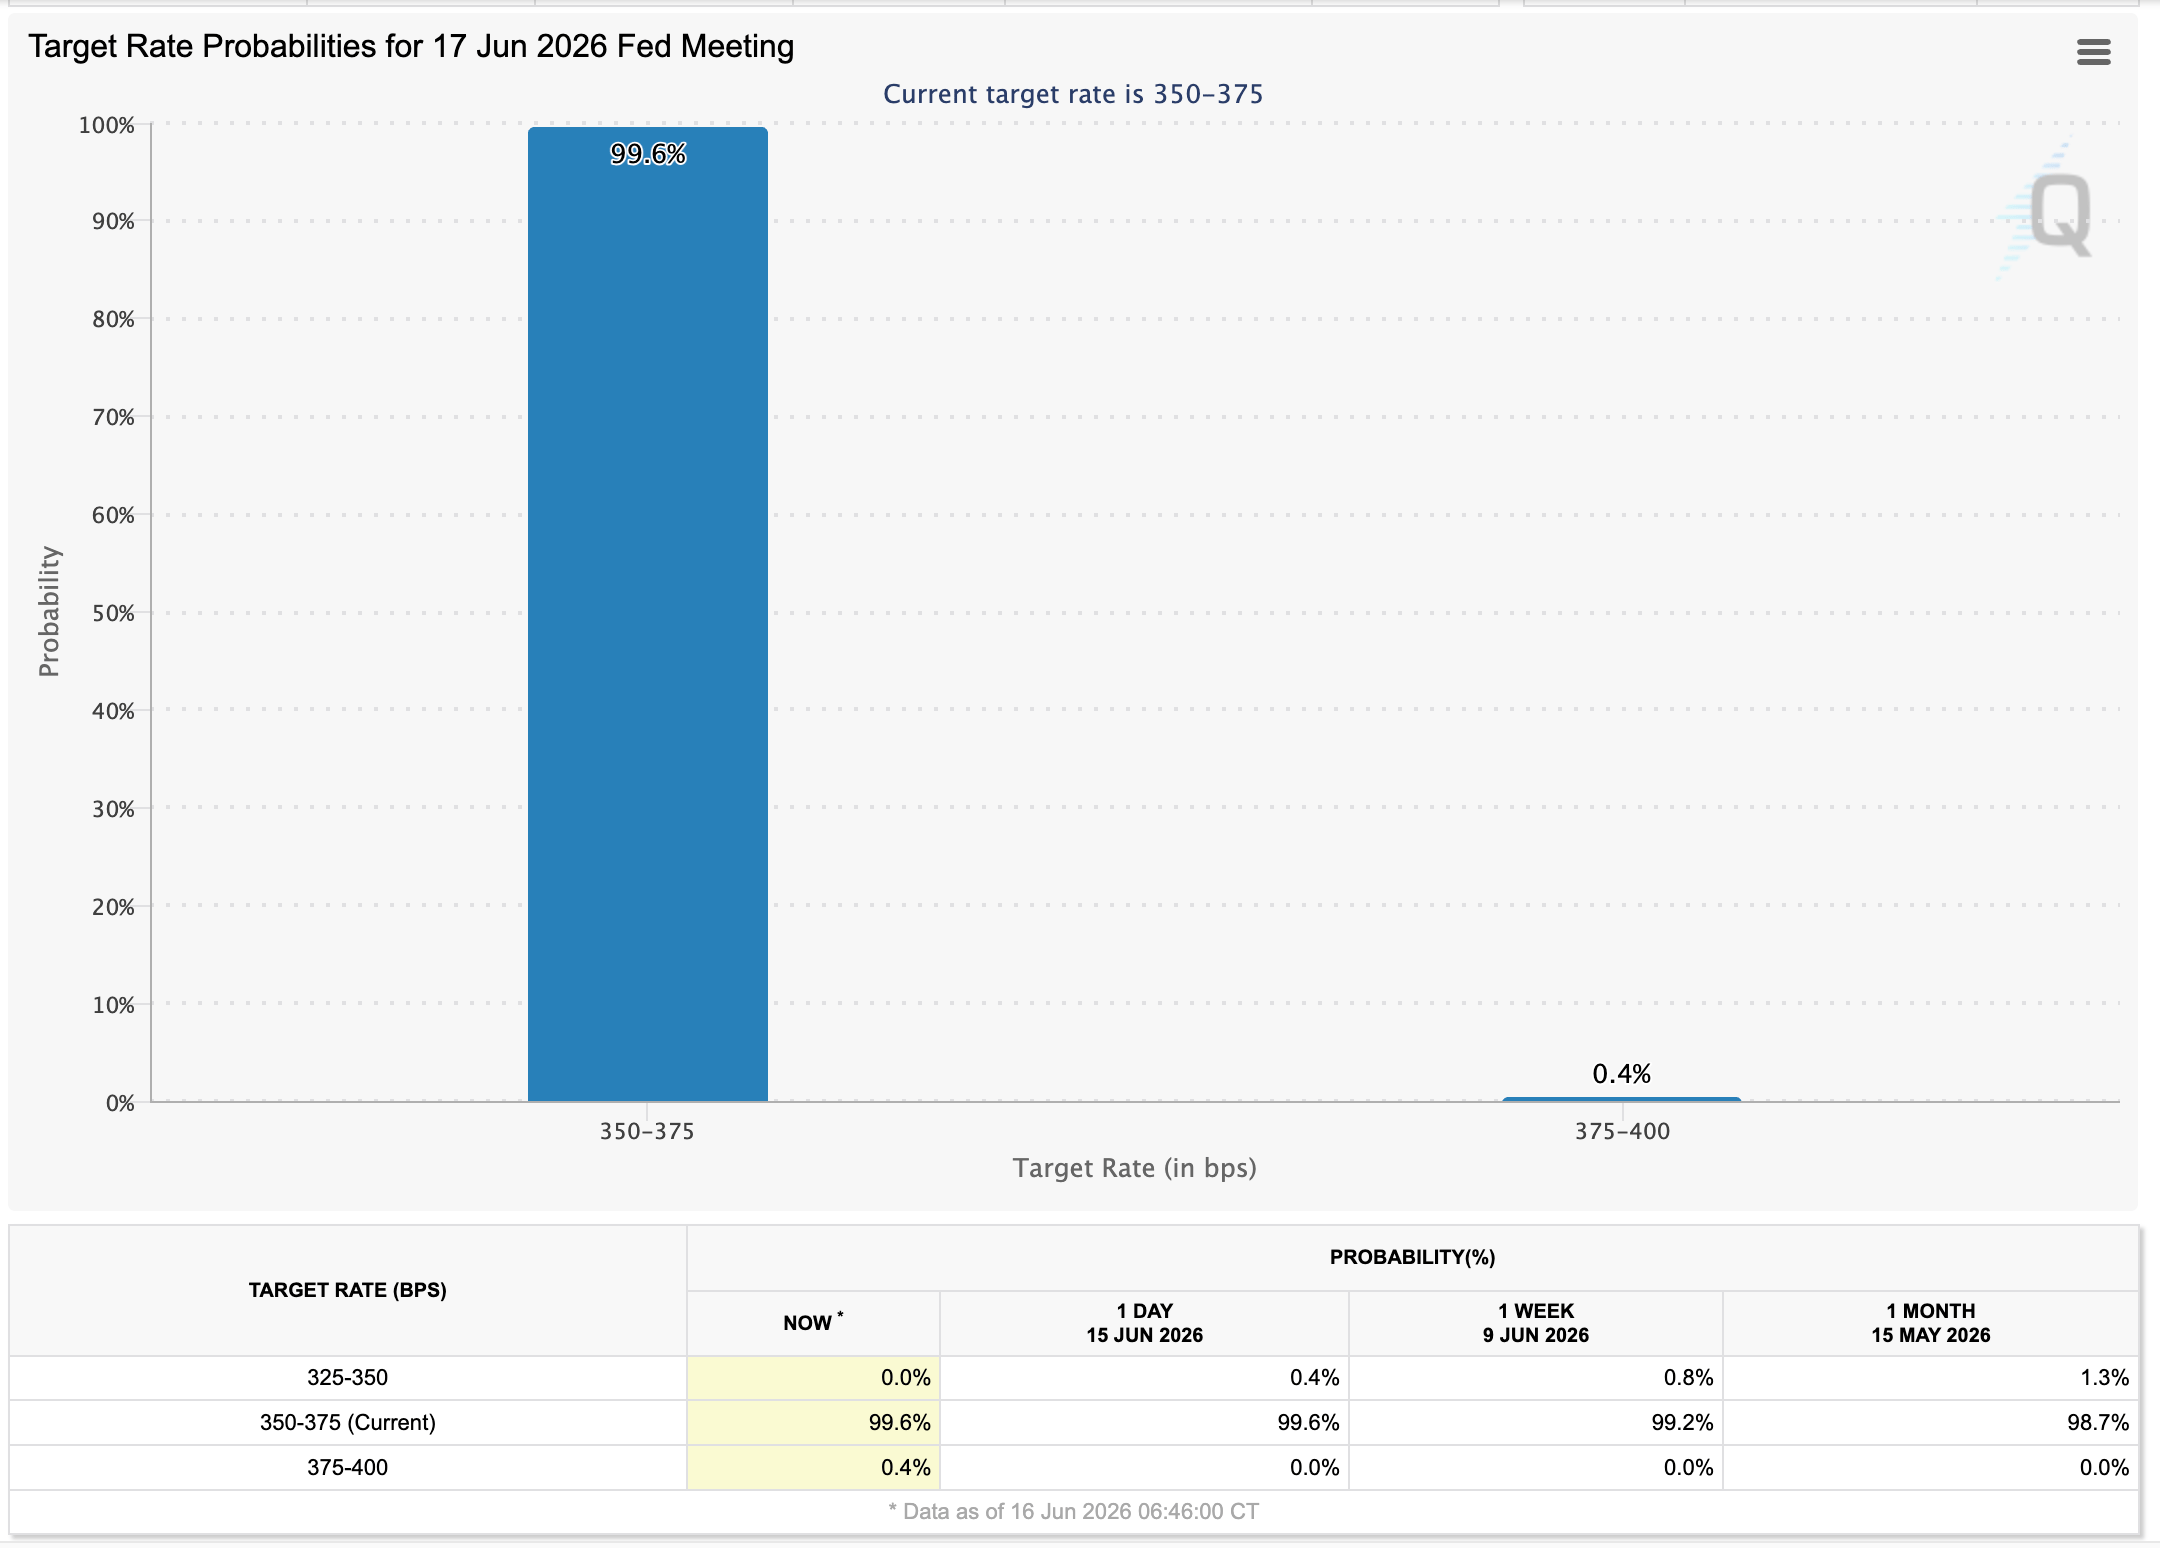
Warsh has argued that it manufactures a false consensus that smothers real debate inside the committee. So the question isn't whether the Fed holds — markets price that at 99.6%. It's whether Warsh uses his first projections to lean dovish, lean hawkish, or quietly signal he intends to dismantle the very communication tool investors are about to dissect.
EUR/USD, like everyone else, is holding its breath.
The pair is trading at 1.1598, virtually unchanged on the day, hovering around its 13-day EMA at 1.1590 as if waiting for permission to move. And, in many ways, it is. The uncertainty surrounding today's meeting is showing up in a market that refuses to commit to either direction.
The charts capture that tension better than any economist can.
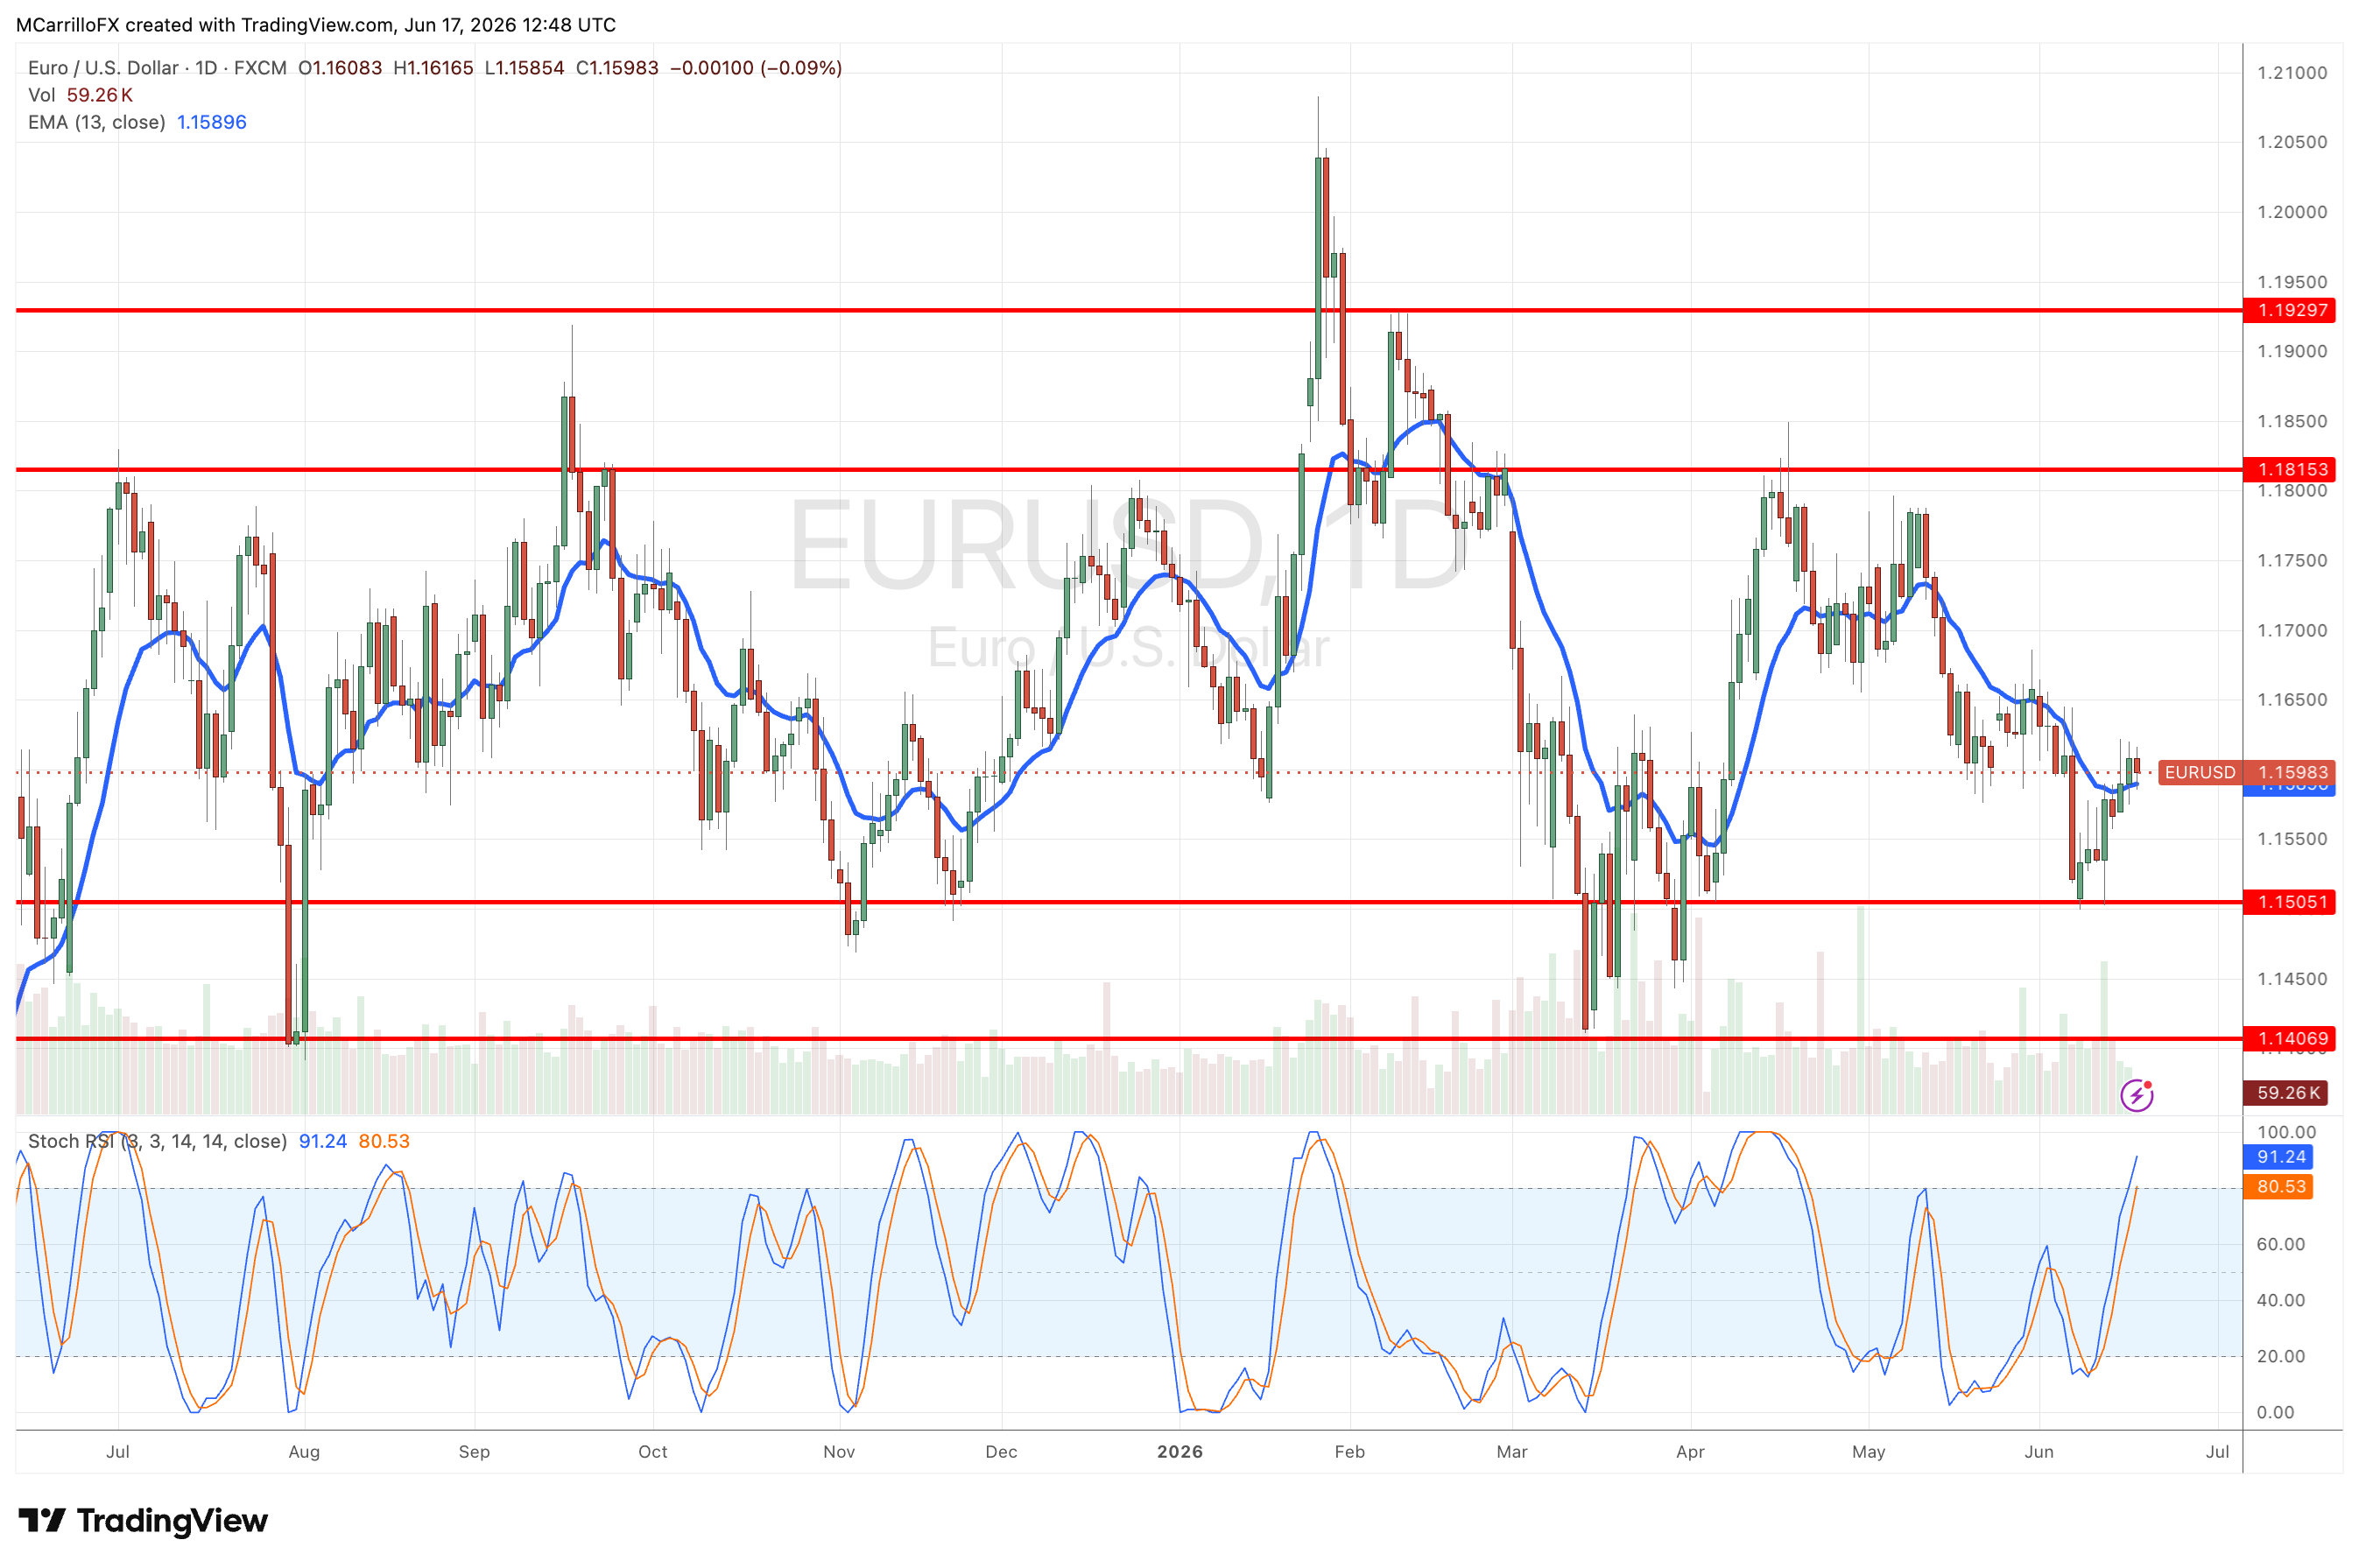
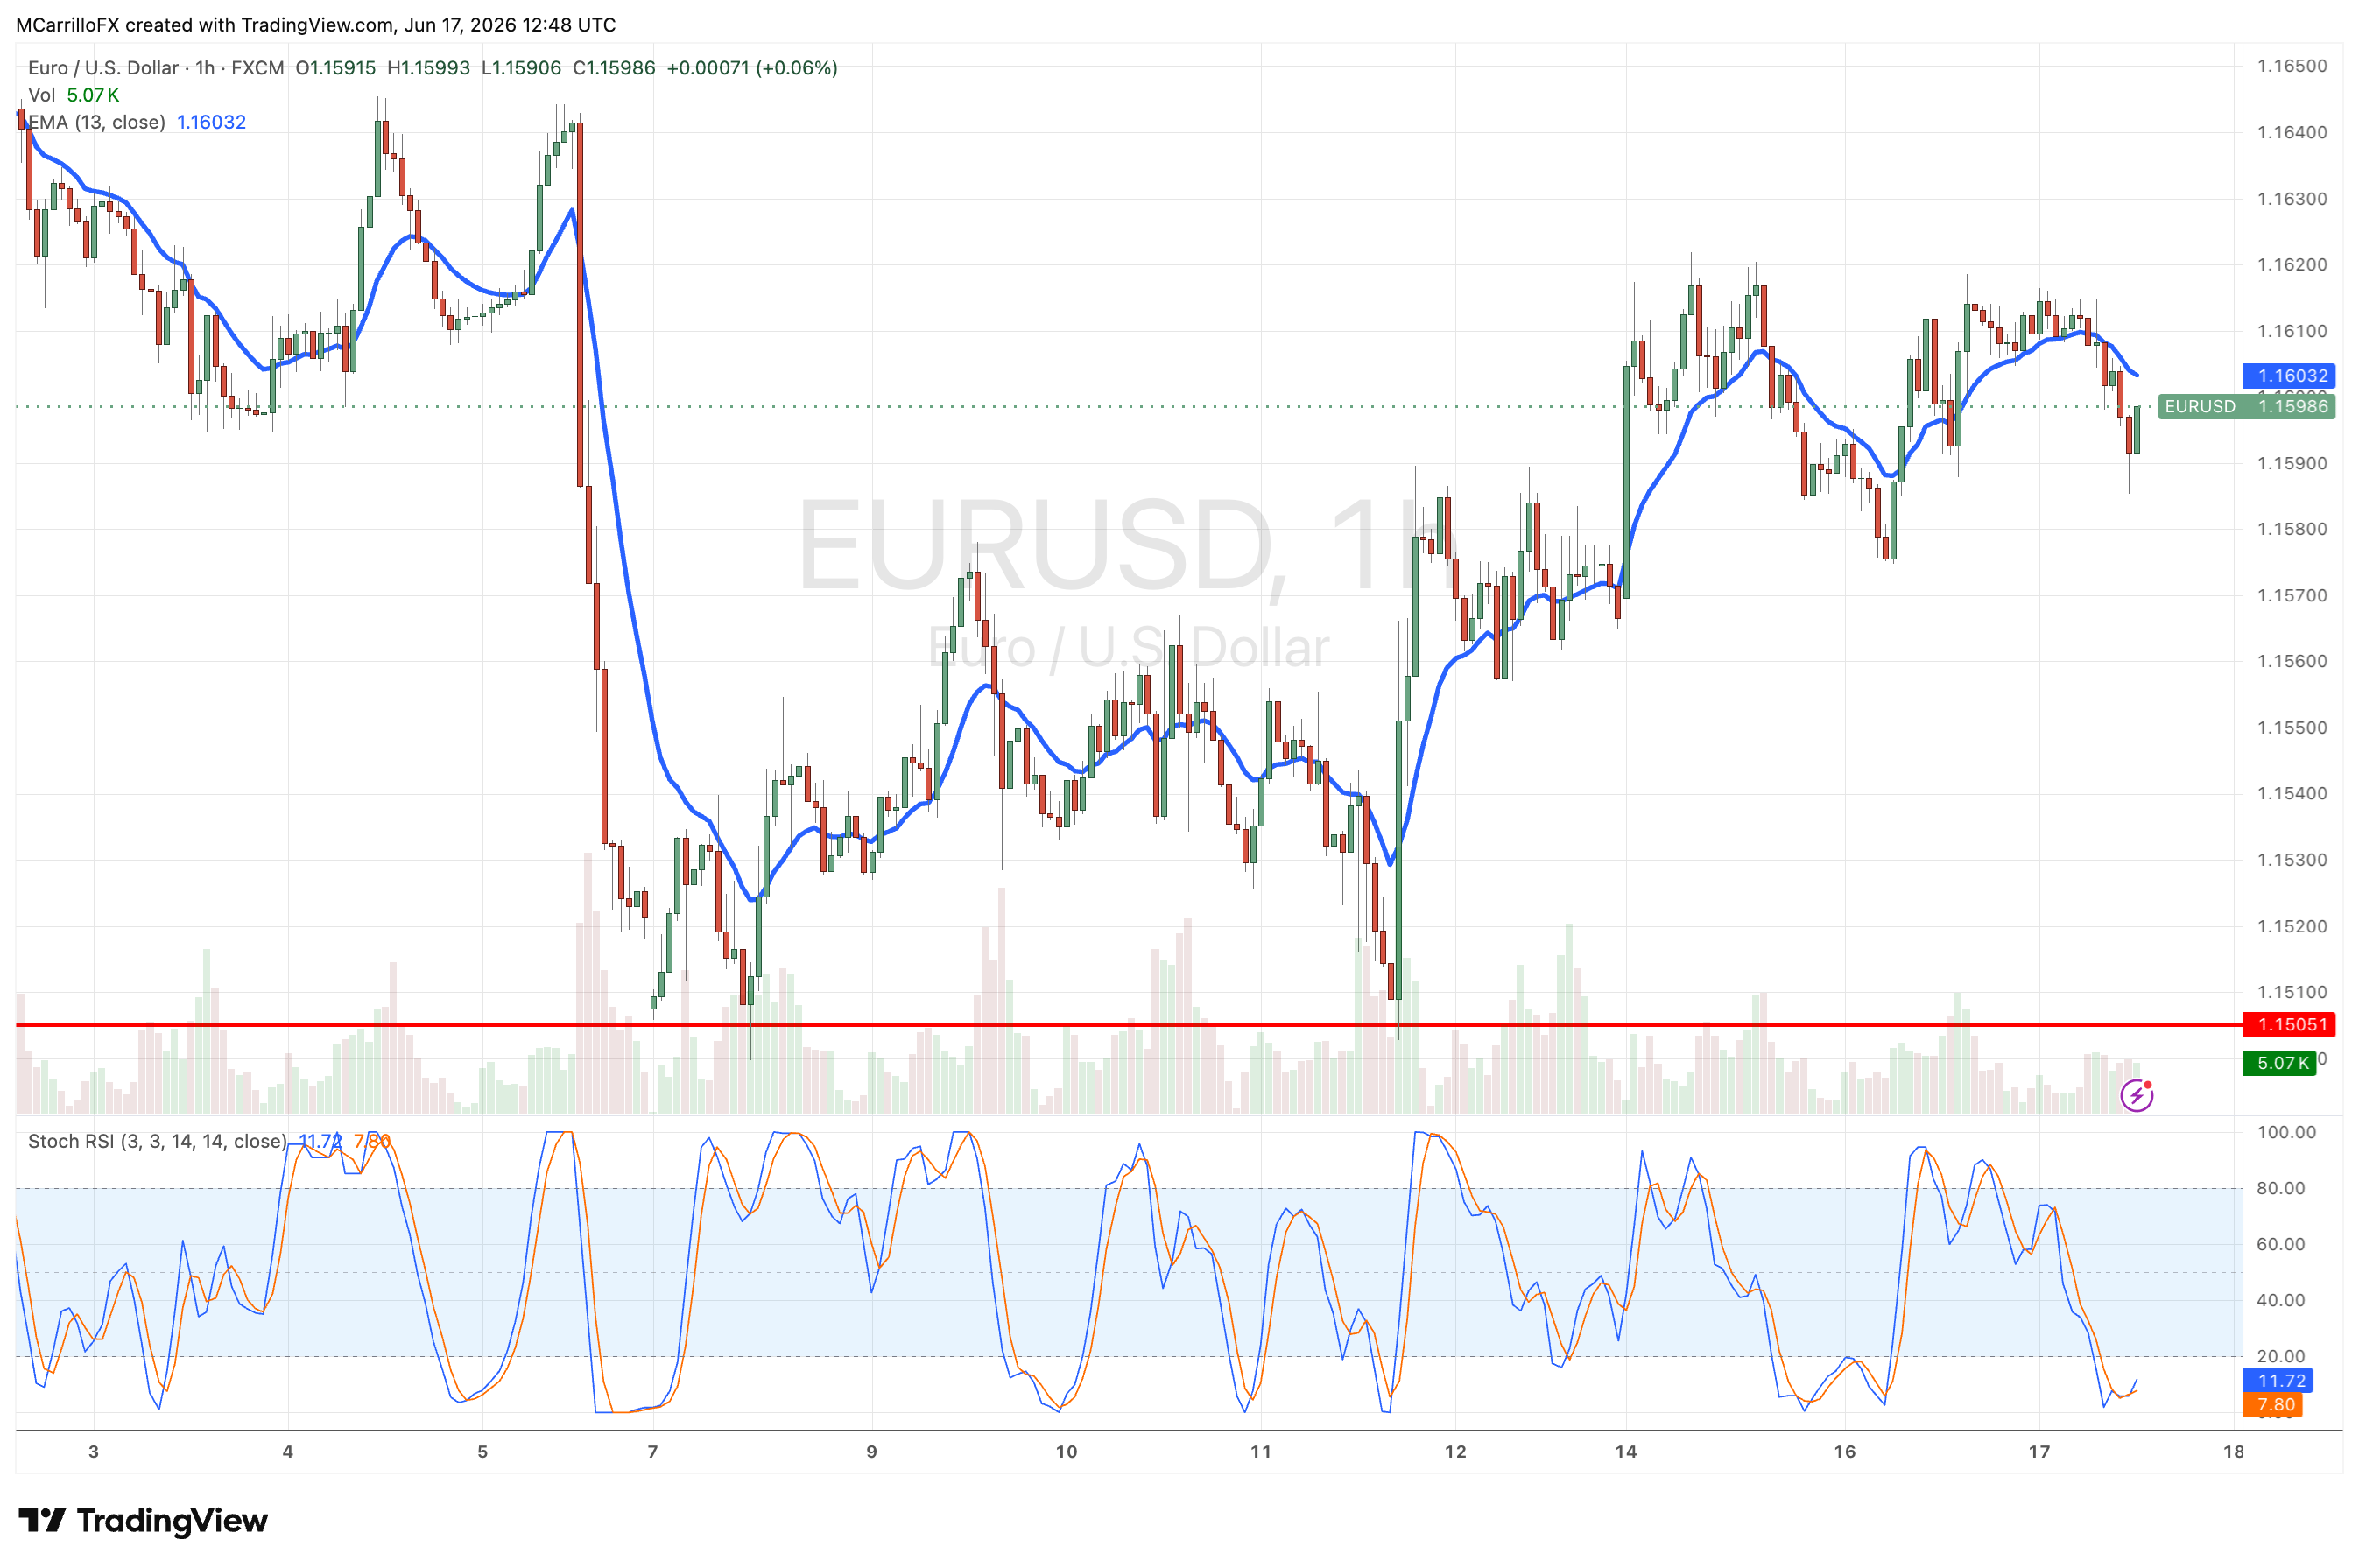
<On a daily basis, Stochastic RSI sits overbought at 91, suggesting the euro's recent grind higher is stretched. Drop to the hourly and the picture inverts: Stoch RSI is oversold near 11, with price slipping back under the short-term EMA at 1.1603. Overbought above, oversold below, coiled in between. That is not a market with conviction. It is a market waiting for a catalyst to hand it one.
The levels that matter
The line in the sand is 1.1505.
It has held every selloff this month, and the hourly chart shows price spiking down to it twice in June before buyers stepped back in. Lose it on a daily close, and the next floor is far below at 1.1407.
To the upside, nothing changes until the euro reclaims real ground. The 13-day EMA at 1.1590 is the immediate pivot. Above it, bulls have to clear 1.1815 before the conversation turns genuinely constructive, and that level has capped every rally since February.
The two scenarios
A dovish surprise — a dot plot that keeps 2026 cuts alive, acknowledging the collapse in oil and easing inflation after the Iran de-escalation — pressures the dollar and gives the euro room to unwind that oversold hourly reading toward the EMA and beyond.
A hawkish hold — Warsh signaling the Fed isn't ready to update its view — does the opposite, and the overbought daily reading becomes the problem. That scenario puts 1.1505 back in play fast.
For now, the euro sits in the middle of its own indecision, waiting for a new chairman to tell it which way to lean.
The coil is tightening.
By this afternoon, it should finally be resolved.
Author

Mauricio Carrillo
Witbrew
Mauricio Carrillo is a financial journalist, fintech executive, and inter-markets analyst with fifteen years of experience at the intersection of traditional finance and digital asset infrastructure.