EUR/USD Bulls Steamroll Over 1.0950 Zone

The EUR/USD broke above the key resistance zone at 1.0950. The breakout and strong bullish impulse invalidated the bearish outlook. What is next for this pair?
4 hour chart
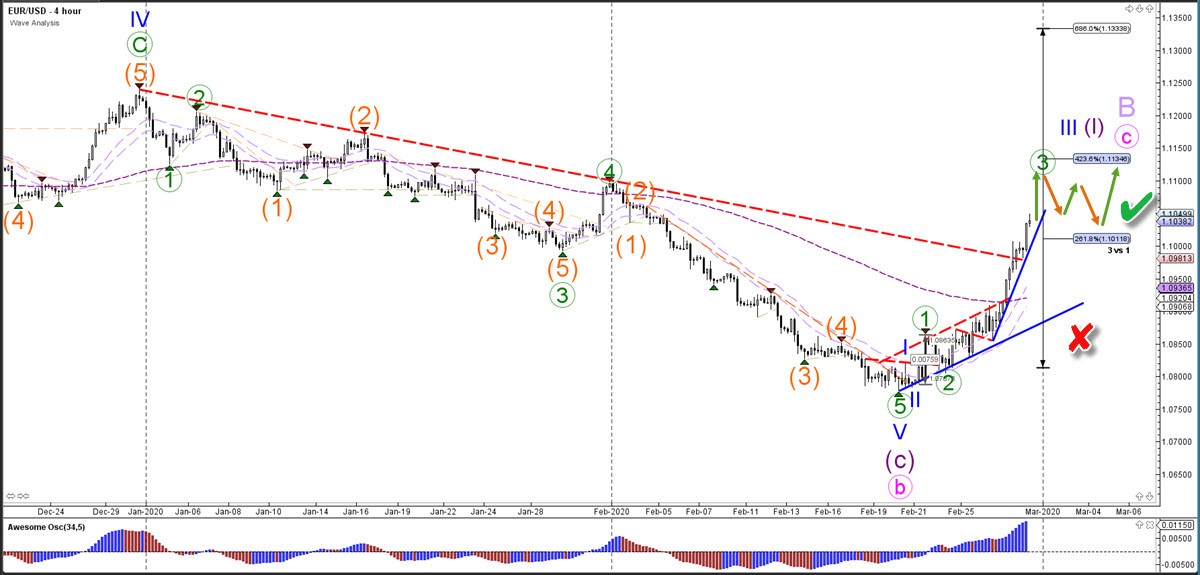
The EUR/USD made a close and reverse. The confirmation of the bullish reversal took place after price action was able to break above the channel resistance (dotted red) and long-term trend line (dotted red). Price could now be in a bullish wave C (green). The bearish swing has probably completed a wave C (purple). More upside is likely at the moment.
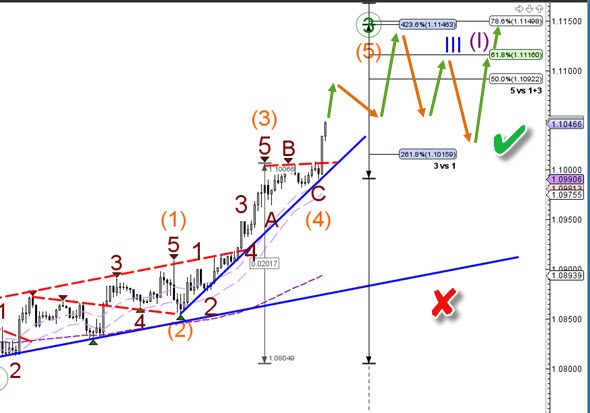
1 hour chart
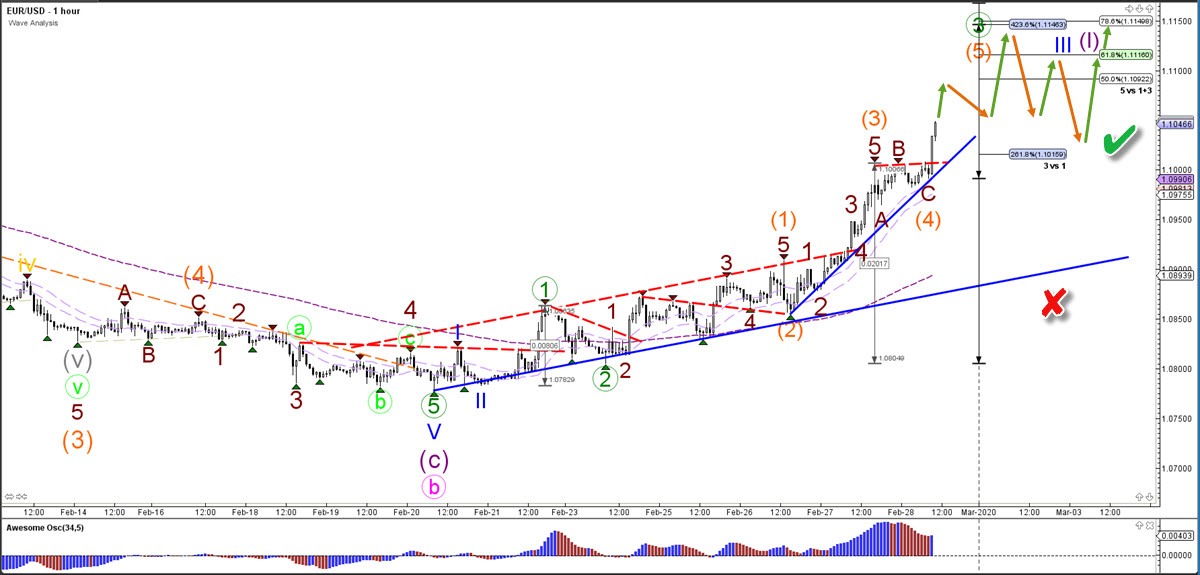
The EUR/USD break seems to be a wave 3 (orange) pattern. After completing a sideways correction in wave 4 (orange), price broke again to the upside. The next target could be as high as 1.11. Eventually a bearish retracement is expected to take place. If pullback is mild, then more upside is expected.
The analysis has been done with the CAMMACD.Core System.
For more daily technical and wave analysis and updates, sign-up up to our ecs.LIVE channel.
Author

Chris Svorcik
Elite CurrenSea
Experience Chris Svorcik has co-founded Elite CurrenSea in 2014 together with Nenad Kerkez, aka Tarantula FX. Chris is a technical analyst, wave analyst, trader, writer, educator, webinar speaker, and seminar speaker of the financial markets.


