|

EUR/USD Bullish Reversal Keeps Uptrend Hopes Alive

The EUR/USD made a bullish bounce at the 61.8% Fibonacci retracement level of wave 4 vs 3, which could indicate a potential uptrend.
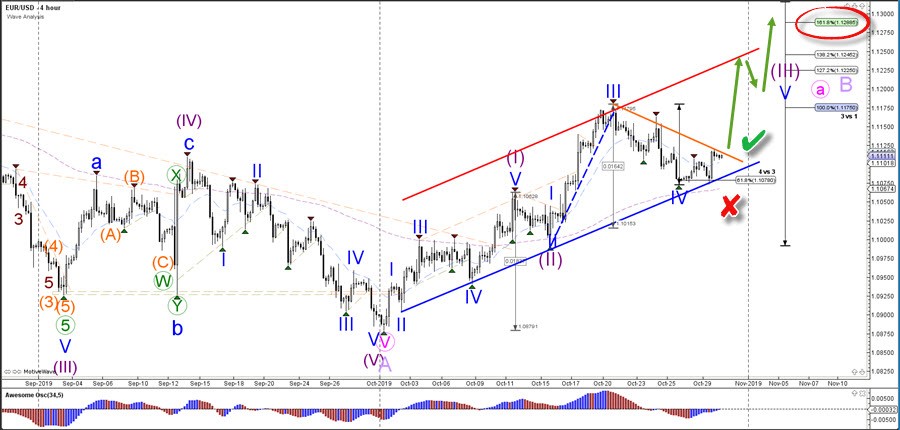
EURUSD

EUR/USD

4 hour

The EUR/USD will need to break above the resistance trend line (red) of the correction before an uptrend is possible. The bullish breakout (green check) should aim for the Fibonacci targets of wave 3 vs 1 with as main target the 161.8% Fibonacci level (red circle). A bearish breakout invalidates (red x) the current wave pattern and wave 4 (blue).
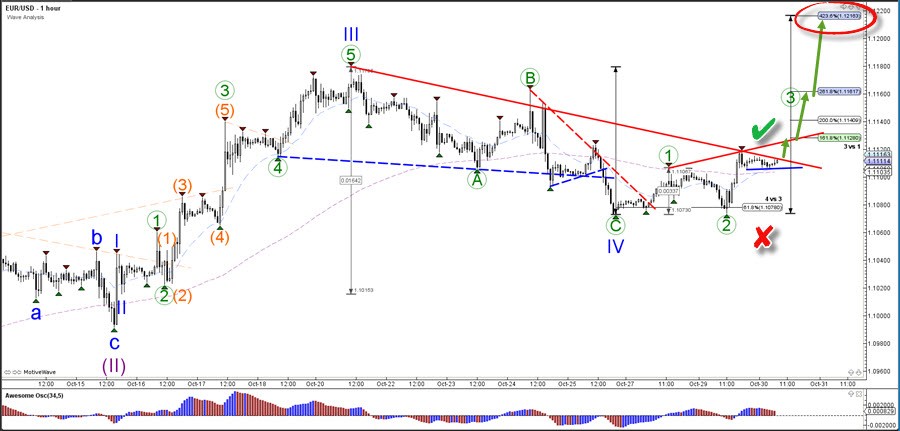
EURUSD

1 hour

The EUR/USD is building a potential wave 3 (green) after the bearish pullback failed to break below the previous support (bottom of wave 1 green). A bullish breakout could confirm (green check) the wave 3 pattern and indicate momentum towards the Fibonacci targets.

EURUSD

The analysis has been done with the CAMMACD.MTF template.

For more daily technical and wave analysis and updates, sign-up up to our ecs.LIVE channel.

Author

Chris Svorcik

Chris Svorcik

Elite CurrenSea

Experience Chris Svorcik has co-founded Elite CurrenSea in 2014 together with Nenad Kerkez, aka Tarantula FX. Chris is a technical analyst, wave analyst, trader, writer, educator, webinar speaker, and seminar speaker of the financial markets.

More from Chris Svorcik
Share:

Editor's Picks

EUR/USD treads water above 1.1850 amid thin trading

EUR/USD stays defensive but holds 1.1850 amid quiet markets in the European hours on Monday.  The US Dollar is struggling for direction due to thin liquidity conditions as US markets are closed in observance of Presidents' Day. 

GBP/USD flat lines as traders await key UK and US macro data

GBP/USD kicks off a new week on a subdued note and oscillates in a narrow range near 1.365 in Monday's European trading. The mixed fundamental backdrop warrants some caution for aggressive traders as the market focus now shifts to this week's important releases from the UK and the US.

Gold sticks to intraday losses; lacks follow-through

Gold remains depressed through the early European session on Monday, though it has managed to rebound from the daily trough and currently trades around the $5,000 psychological mark. Moreover, a combination of supporting factors warrants some caution for aggressive bearish traders, and before positioning for deeper losses.

Bitcoin, Ethereum and Ripple consolidate within key ranges as selling pressure eases

Bitcoin and Ethereum prices have been trading sideways within key ranges following the massive correction. Meanwhile, XRP recovers slightly, breaking above the key resistance zone. The top three cryptocurrencies hint at a potential short-term recovery, with momentum indicators showing fading bearish signs.

Global inflation watch: Signs of cooling services inflation

Realized inflation landed close to expectations in January, as negative base effects weighed on the annual rates. Remaining sticky inflation is largely explained by services, while tariff-driven goods inflation remains limited even in the US.

Ripple Price Forecast: XRP potential bottom could be in sight

Ripple edges up above the intraday low of $1.35 at the time of writing on Friday amid mixed price actions across the crypto market. The remittance token failed to hold support at $1.40 the previous day, reflecting risk-off sentiment amid a decline in retail and institutional sentiment.