EUR/USD breaks higher: Bullish momentum builds above 1.1590 amid macro tailwinds

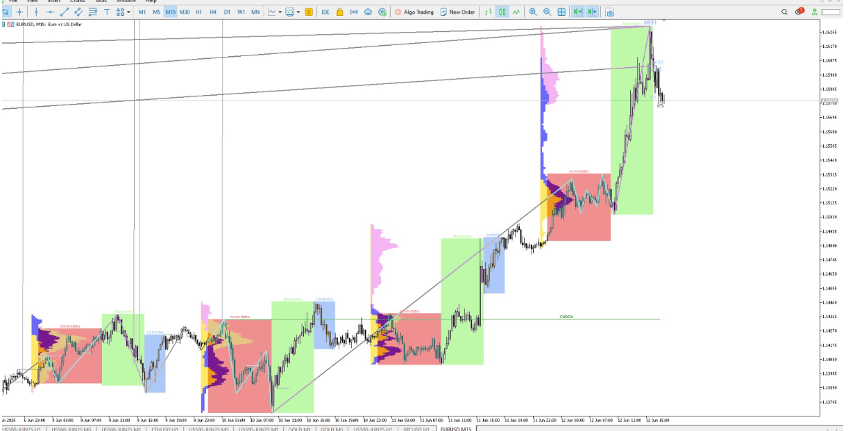
The EUR/USD pair is showing strong bullish momentum after a confirmed breakout above the Gann 1×1 angle and a key level at 1.1590. Price is now holding within the strategic 1.1690–1.1731 resistance zone, with short-term targets pointing toward 1.1690 and beyond. While the trend remains upward, a correction toward the 1.1505 area can’t be ruled out.
This bullish bias is supported by macro factors including softer U.S. inflation data, shifting ECB policy expectations, and ongoing geopolitical uncertainty in the Middle East. Traders may find opportunities on pullbacks, especially near ICT order blocks and key vibrational levels.
Technical setup and Gann mapping (0° Aries = 11520)
- Current price: 1.1590 → mapped to 11590.
- Top placed: 1.1630 → 11630.
- Gann 1×1 line was breached around 1.1590; momentum confirmed above it.
Zodiacal degrees → price zones
- Gemini zone: 11580–11610
- Cancer zone: 11610–11640
Mapping
- 11590 = 110° (mid Gem)
- 11640 = 130° (Leo entry)
Price zones and key thresholds
|
Purpose |
Price Range |
Notes |
|---|---|---|
|
Accumulation/resp |
11574–11598 |
Uranus, Jupiter confluence |
|
Primary breakout |
11590–11610 |
Current zone, supports bullish continuation |
|
Expansion ahead |
11610–11630 |
Cancer → Leo transition |
|
Ceiling top |
11630–11670 |
Target zone, at Gann angle and planet extremes |
|
Pullback candidate |
11505–11490 |
Likely mean-reversion into Gann 2×1 or Fibonacci zone |
Quantitative indicators and projections
- Linear regression channel: Mean = ~1.1520; +2σ extension ≈ 1.1670
- ARIMA (2,1,2) projection: indicates possible pullback to 11540–11570 before next leg up.
- Rate-of-change peak near 11590 suggests short-term exhaustion.
Planetary price alignment (using 11520 Aries base)
|
Planet |
Degree |
Mapped Price |
Notes |
|---|---|---|---|
|
Sun (Gem) |
21° |
11601 |
Trend driver |
|
Mercury (Gem) |
24° |
11604 |
Liquidity spike zone |
|
Venus (Gem) |
27° |
11607 |
Retail/speculative activity |
|
Moon (Can) |
2° |
11612 |
Upcoming emotion-driven surge |
|
Mars (Leo) |
6° |
11646 |
Breakout trigger( top) |
|
Jupiter (Gem) |
18° |
11598 |
Support base |
|
Uranus (Tau) |
54° |
11574 |
Entry / pullback zone |
Price currently sits at the Jupiter–Uranus transition zone, with Sun/Mercury/Venus cluster ahead, and lunar support building toward Mars-triggered breakout.
Macro and fundamental drivers
US data
- U.S. PPI softer than expected → Fed rate-cut expectations rising,
- U.S. CPI modest → dovish tilt likely remains
- ECB nearing end of easing; euro supported
Middle East conflict
- Rising tensions (Israel–Iran) drove oil near $70–67/barrel and boosted safe-haven gold.
- Middle East geopolitical risk increases demand for USD, CHF, JPY — pressure on EUR/USD.
The conflict heightens volatility; EUR/USD gains supported by weak dollar but could face intermittent USD safe-haven pullbacks.
COT positioning
- Speculative net longs trending higher (Large Spec +8k, Leveraged +8k) → aligned with bullish technically.
- No current COT update due this week; previous data suggest continued long bias.
Trading strategy
- Short-term: Potential pullback toward 1.1505–, aligning with Gann 2×1 or Fibonacci confluence.
- Then: Another push to 1.1690–1.1705
- Ceiling: 1.1730– holds as firm resistance; extended zone up to 1.1770 possible if dollar weakens further.
- Risk zones: A deeper pullback (11505–11480) possible if Middle East escalates sharply and safe-haven flows intensify.
Final note
EUR/USD is currently in a bullish breakout phase following a Gann 1×1 breakout and technical confirmation at 1.1590. It’s positioned in a key zone (11690–11731), with short-term targets at 1.1690. However, potential corrections to 1.1505 should be expected next. Macro catalysts—softer U.S. inflation, ECB policy, and Middle East conflict—support a volatile yet bullish bias. Use pullbacks for re-entries aligned with ICT order blocks and vibrational zones.
Author

Faysal Amin
Mind Vision Traders
Faysal Amin is a seasoned financial analyst and market strategist with over a decade of experience in global markets, including equities, forex, and commodities.


