EUR/USD: A bullish Elliott Wave perspective

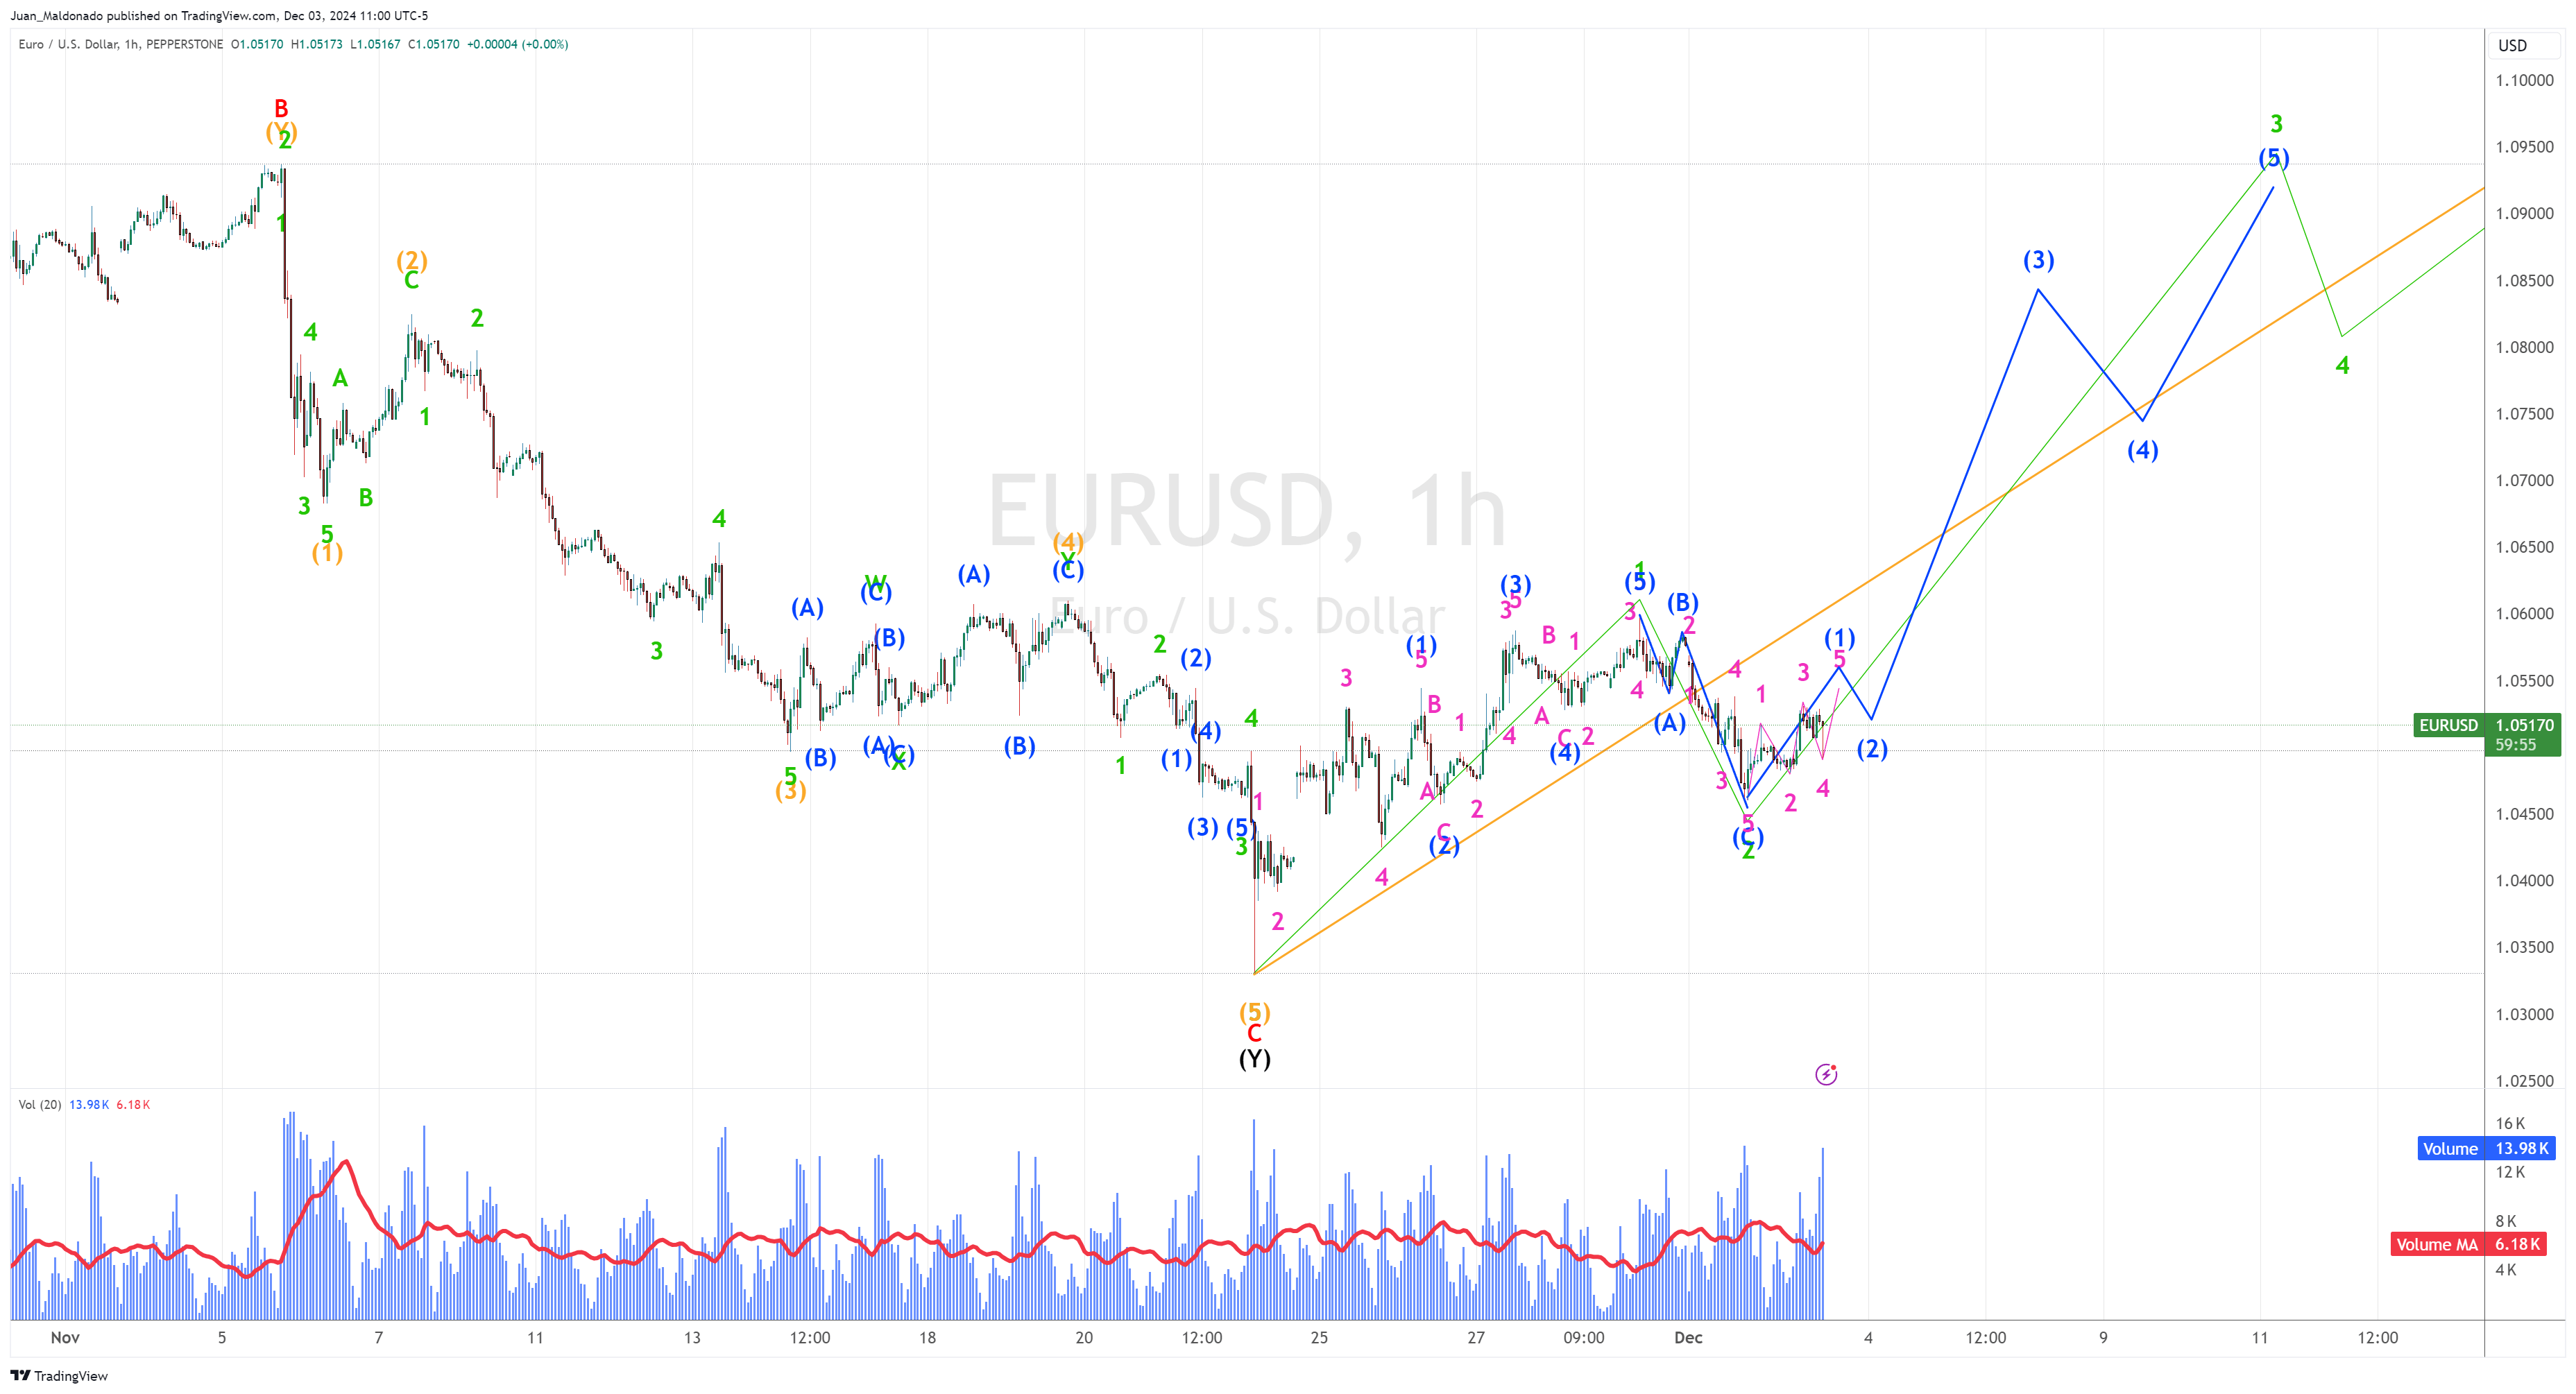
Let’s analyze this chart to understand how price cycles help us predict future movements in EUR/USD. According to the Elliott Wave count, the low recorded in November (1,0332) marks the beginning of a potential bullish impulse. We observe five waves in blue completing the first impulse (Wave 1 of green degree), reaching 1.0580. Next, we see a Zigzag pattern characterizing Wave 2 (green degree). What can we expect from here? Let’s explore the possible scenarios together.
Main scenario
We anticipate continuing the bullish trend (Wave 3 of green degree). Wave three corresponds to public participation and is typically the fastest wave. The price has completed the second wave and is now building the foundation for Wave 3.
Alternative scenarios
It’s possible that Wave 2 of Green Degree is still active and needs to drop a bit further. We must extend the corrective wave using a double Zigzag pattern in this case. Detecting the price reversal in time is crucial to avoid losses. The price should exhibit small-bodied bearish candles to maintain the corrective Wave 2 scenario in green degree.
Targets
Let’s now look at the targets for the bullish cycle using liquidity zones. From smallest to largest, these levels will serve as resting points during the trend: 1,06 – 1,0840 – 1,0940. It’s essential to confirm each step through price action and volume to make informed decisions as each new candle forms.
Author

Juan Maldonado
Elliott Wave Street
Juan Maldonado has a University degree in Finance, and Foreign trade started his trading career in 2008. Since 2010 has been analyzing the markets using Elliott Wave with different strategies to spot high probability trades.


