EUR/USD: A breakout making the pair bullish
EUR/USD produced a doji candle on the daily chart yesterday. Today's intraday price action suggests that the price has found its support. The H1 chart produces a double bottom and the pair is trading above the neckline level as of writing. If the price consolidates and produces a bullish reversal candle, the buyers may get an opportunity to go long on the pair.
Chart 1 EUR/USD H1 Chart
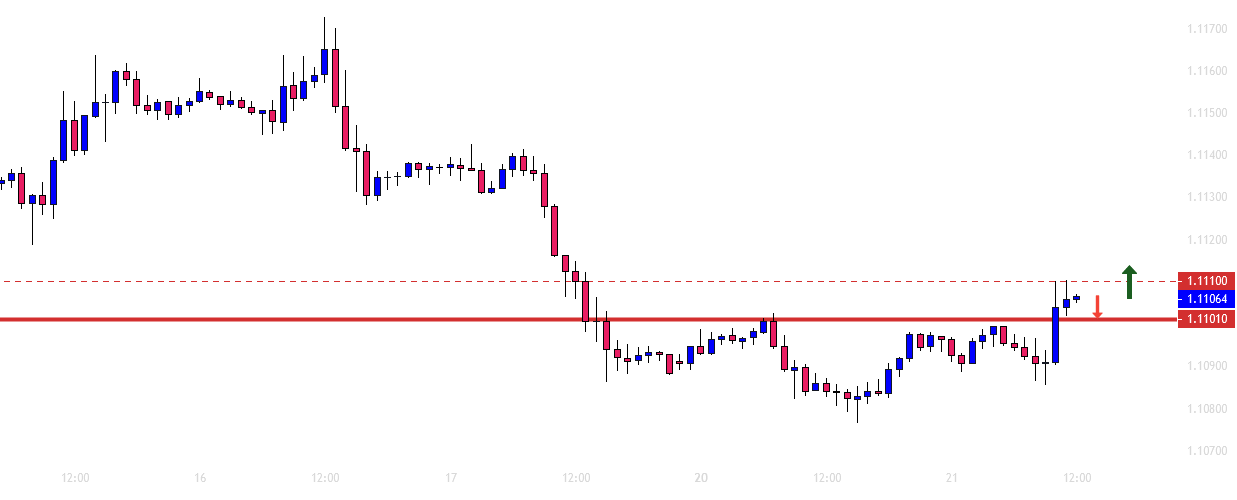
The chart shows that one of the H1 candles breached the level of 1.11010. The price has had rejection twice at the level of 1.11100. If it consolidates around the level of support and produces a bullish reversal candle, the buyers may trigger a long entry above the level of 1.11100.
Trade Summary:
Entry: Buy above 1.11100
Stop Loss: Below 1.11010
Take Profit 1: 1.11245
Take Profit 2: 1.11355
Take Profit 3: 1.11490
Please Note
The price may hit Take Profit 1 and Take Profit 2 easily but it may make a correction before hitting Take Profit 3.
Author

EagleFX Team
EagleFX
EagleFX Team is an international group of market analysts with skills in fundamental and technical analysis, applying several methods to assess the state and likelihood of price movements on Forex, Commodities, Indices, Metals and


