EUR/NZD: Ascending Triangle’s breakout to determine the next direction

EUR/NZD has been choppy on the daily chart. The price seems to have found a strong level of resistance where it has had several rejections. Yesterday's daily candle came out as a bearish Marubozu candle. With the effect of that, today's intraday price action has been bearish. As far as the daily chart is concerned, the price has been caught within an ascending Triangle, and it is approaching the support. A breakout at the Triangle's support may drive the price towards the South. Have a look at the chart below.
Chart 1 EUR/NZD Daily Chart
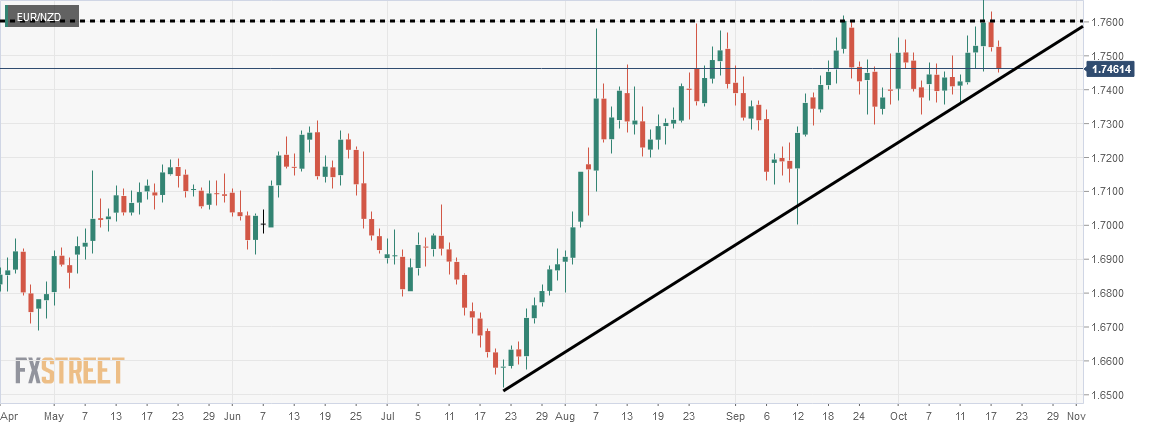
The chart shows that the price has had several bounces at the support and rejections at the resistance of the Triangle. Ideally, the price still is to cover a lot of ground to reach at the point to make a decision which way it would head to. However, intraday price action suggests that we may get an early breakout here. Let us have a look at the daily chart below.
Chart 2 EUR/NZD Daily Chart
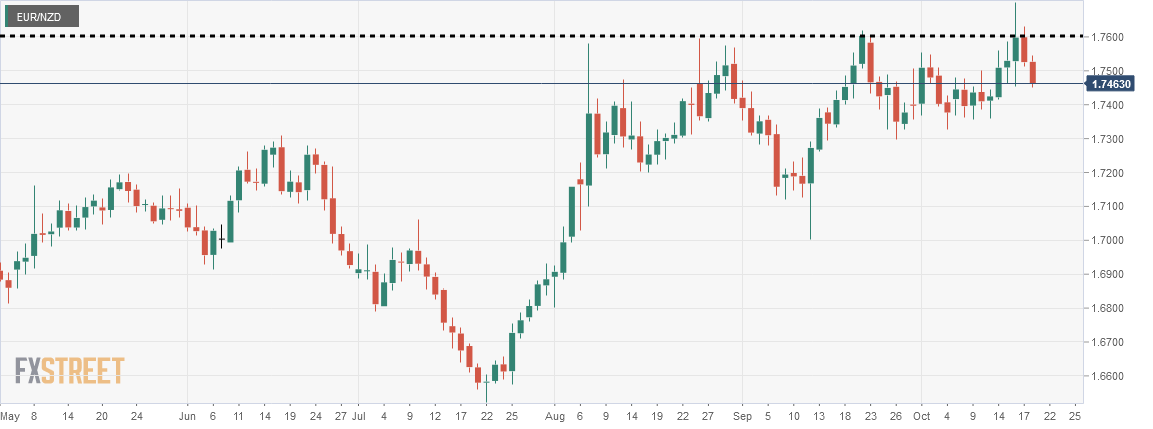
At the second rejection, it seems that the pair may end up producing a Double Top. The neckline lies at the level of 1.7300. The buyers may want to wait for the price to go again and have a bounce there. This would allow them to hunt some green pips. However, if the price comes back at the horizontal support at 1.7300, the daily candle may end up making a breakout at the support of the ascending Triangle. Let us now observe the H4 chart.
Chart 3 EUR/NZD H4 Chart
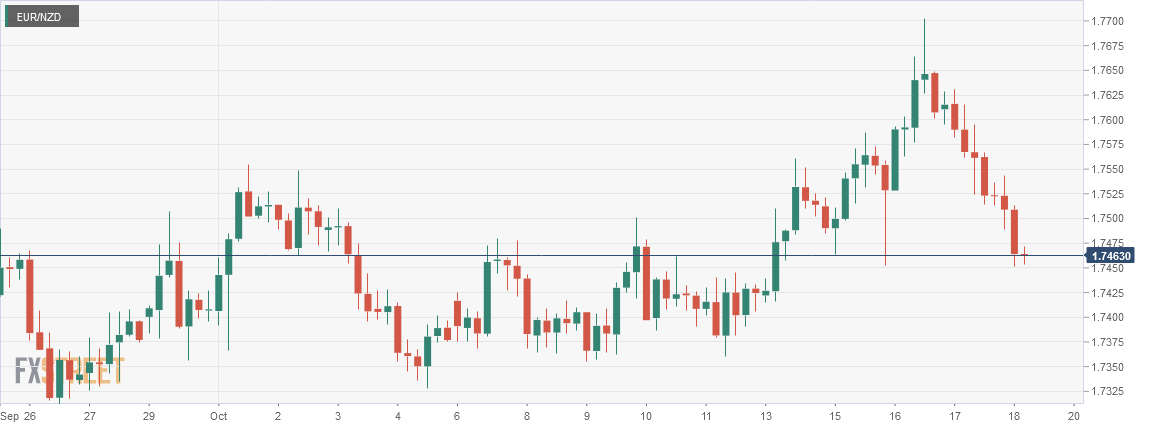
The H4 chart shows that after producing a bearish Pin Bar, the price has been heading towards the South at a good pace. Any upside correction/consolidation may attract the sellers to add more short positions. Considering the H4 chart, the next major support lies at 1.7350, which means intraday traders have enough room to stick with their short positions.
Both the daily and H4 charts look good for the sellers, and a downside breakout of the ascending Triangle looks very feasible. However, this is a massive decision for the price to make. Thus, it might as well remain choppy on the daily chart within the triangle. Either it makes a breakout today, or later, the breakout is going to determine EUR/NZD's direction for some weeks. The question is whether it takes place today or not. Let us wait to find out how the drama ends.
Author

EagleFX Team
EagleFX
EagleFX Team is an international group of market analysts with skills in fundamental and technical analysis, applying several methods to assess the state and likelihood of price movements on Forex, Commodities, Indices, Metals and


