|

EUR/JPY pulls back towards crucial trendline [Video]

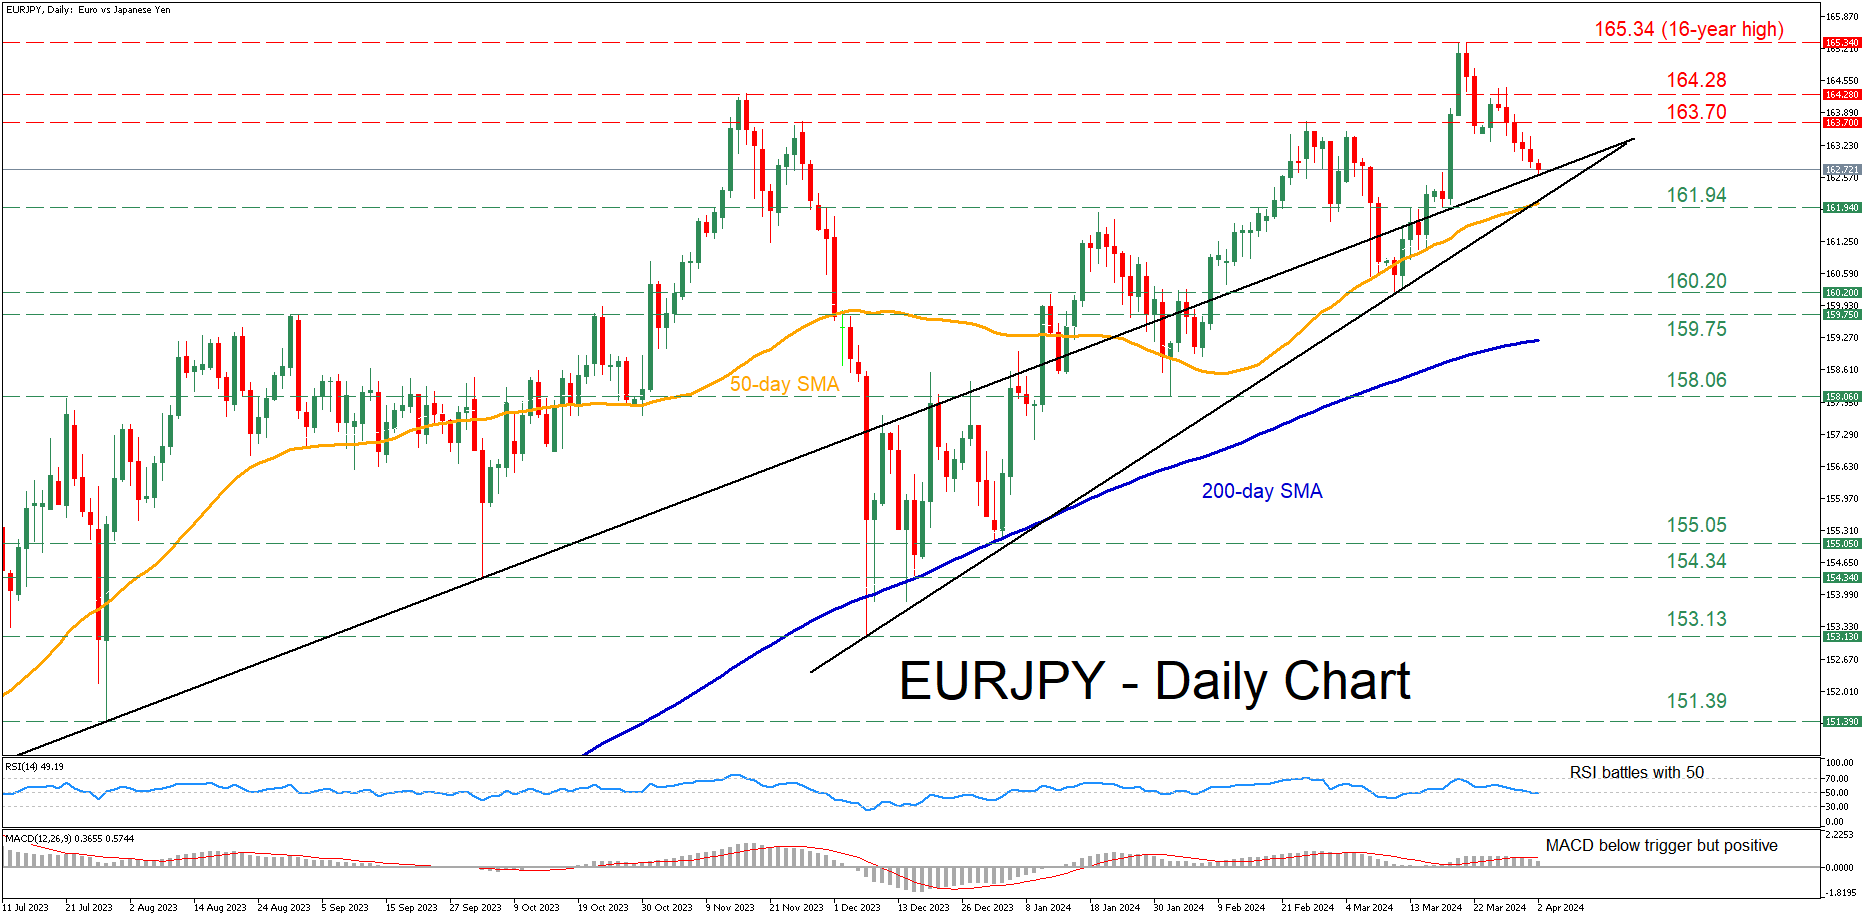
  • EURJPY retraces lower following a 16-year peak.

  • Tests ascending trendline drawn from July 2023.

  • Oscillators suggest weakening momentum.


EURJPY had been in a steady advance since December 2023, peaking at a fresh 16-year high of 165.34 on March 20. Since then, the pair has been undergoing a downside correction, with the upward sloping trendline that connects higher lows since July 2023 currently acting as a strong support.

Should the trendline fail to hold its ground, the pair could slide towards the recent support of 161.94, which lies very close to the 50-day simple moving average (SMA). A violation of that zone could pave the way for the Mach bottom of 160.20. Further declines might then cease at the August-October resistance region of 159.75, which might serve as support in the future.

On the flipside, bullish actions could propel the price towards the February peak of 163.70. Conquering that barricade, the bulls may attack the 2023 high of 164.28. If that barrier fails, the price could ascend to revisit its 16-year high of 165.34.

In brief, EURJPY has been on the retreat in the past few sessions, experiencing a solid setback from its recent 16-year peak. For the bears to gain confidence for a sustained decline, the pair needs to break below the 50-day SMA.

Chart

Author

Stefanos Oikonomidis

Stefanos joined XM as a Junior Investment Analyst in September 2021. He conducts daily market research on the currency, commodity and equity markets, from a fundamental and a technical perspective.

More from Stefanos Oikonomidis
Share:

Editor's Picks

EUR/USD extends its optimism past 1.1900

EUR/USD retains a firm underlying bid, surpassing the 1.1900 mark as the NA session draws to a close on Monday. The pair’s persistent uptrend comes as the US Dollar remains on the defensive, with traders staying cautious ahead of upcoming US NFP prints and CPI data.
 

GBP/USD tilts bullish as markets barrel toward mid-week NFP print

GBP/USD is holding a broader bullish structure on the daily chart, with price trading well above the 50 Exponential Moving Average at 1.3507 and the 200 EMA at 1.3310, confirming the intermediate uptrend that has been in place since the November 2025 low near 1.2300. 

Gold pushes back above $5,000

The daily chart shows spot Gold in a parabolic uptrend that accelerated sharply from the $4,600 area in late January, printing a record high at $5,598.25 before a violent reversal erased nearly $1,000 in value during the final days of the month. 

Litecoin eyes $50 as heavy losses weigh on investors

Following a strong downtrend across the crypto market over the past week, Litecoin holders are under immense pressure. The Bitcoin fork has trimmed about $1.81 billion from its market capitalization since the beginning of the year, sending it below the top 20 cryptos by market cap.

Japanese PM Takaichi nabs unprecedented victory – US data eyed this week

I do not think I would be exaggerating to say that Japanese Prime Minister Sanae Takaichi’s snap general election gamble paid off over the weekend – and then some. This secured the Liberal Democratic Party (LDP) an unprecedented mandate just three months into her tenure.

Ripple exposed to volatility amid low retail interest, modest fund inflows

Ripple (XRP) is extending its intraday decline to around $1.40 at the time of writing on Monday amid growing pressure from the retail market and risk-off sentiment that continues to keep investors on the sidelines.